


This strategy caught a handful of signals on both USD/CAD and CAD/CHF this week.
Was it able to keep up its winning streak?
In this revised version of the Short-Term Bollinger Reversion Strategy, I’m waiting for RSI to cross above or below oversold or overbought levels to indicate a bit more momentum in the direction of the trade.
Make sure you review the tweaks here.
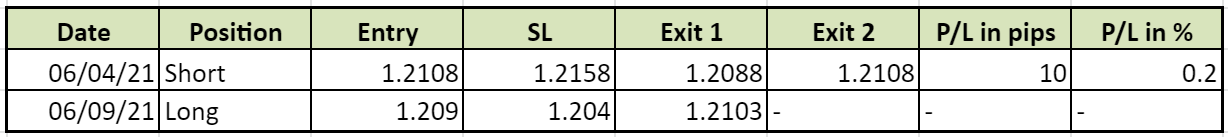
USD/CAD was off to a running start, as a short signal popped up early in the week.
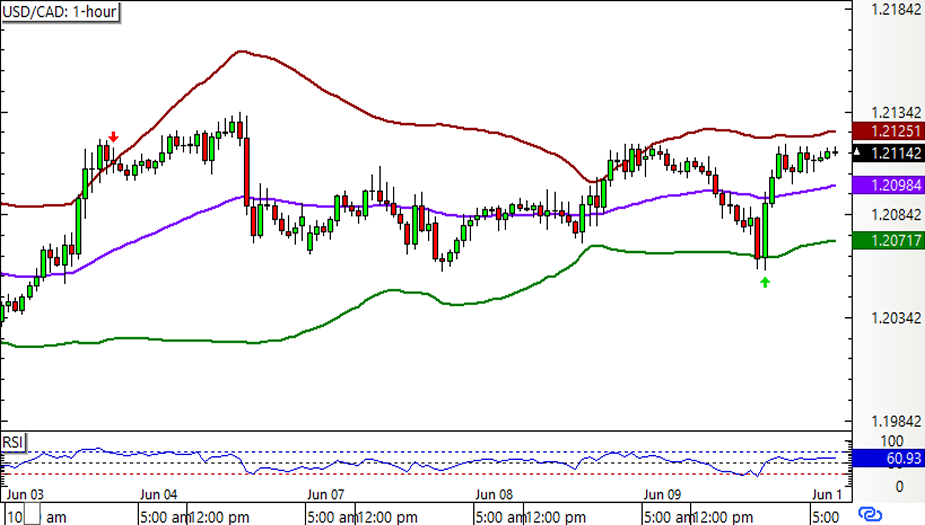
Another round of consolidation took place during the middle of the week, and USD/CAD popped back up to hit the adjusted SL at entry.
A valid long position followed, and this one almost immediately hit its first PT at the middle band. The remaining half is still open for now.
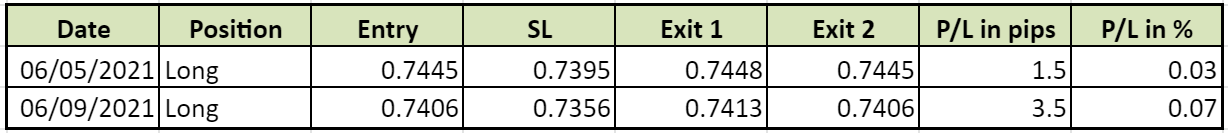
Meanwhile, CAD/CHF was trending lower throughout the week, but it still snagged a couple of long positions on tests of the bottom Bollinger Band.
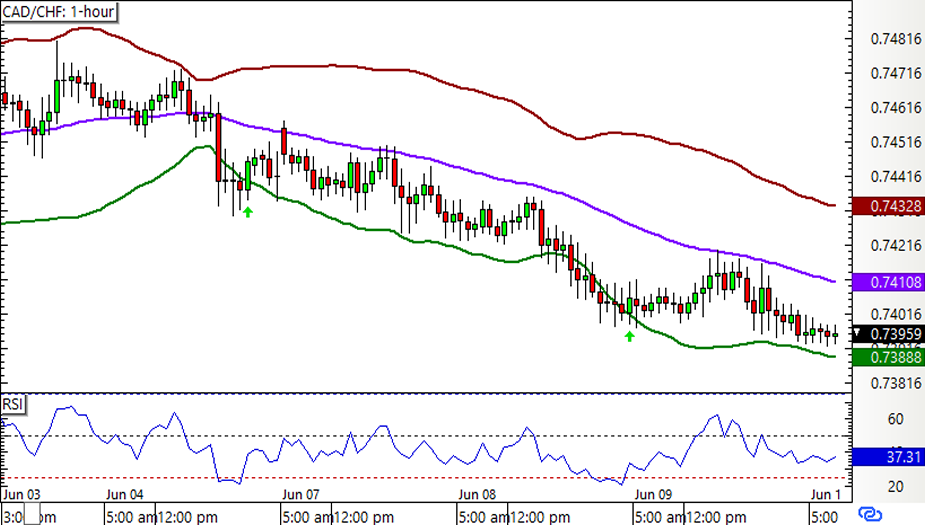
Fortunately, the pair was able to reach the middle band on the bounce higher, allowing it to lock in gains and move the stops to entry.
This kept CAD/CHF in the green, as the remaining half-positions were closed at entry before the drops took place.Here’s how it all added up:
With that, the Short-Term Bollinger Reversion Strategy bagged 15 pips or 0.3% for the week.
I know it ain’t much, but I’m still happy this one is carrying on with its winning streak!
Seen how the numbers turned out for Q1 2021 yet?