


Did this mean reversion strategy fare just as well as my momentum and trade systems did for Q1 2021?
Time to find out!
In this revised version of the Short-Term Bollinger Reversion Strategy, I’m waiting for RSI to cross above or below oversold or overbought levels to indicate a bit more momentum in the direction of the trade.
Make sure you review the tweaks here.
And I know I haven’t really covered the position sizing rules for this system just yet but, for simplicity’s sake, I decided to assume a 1% risk per trade in order to help me analyze total performance.Since I’m running this strategy on a per pair basis, I crunched the numbers for USD/CAD first:
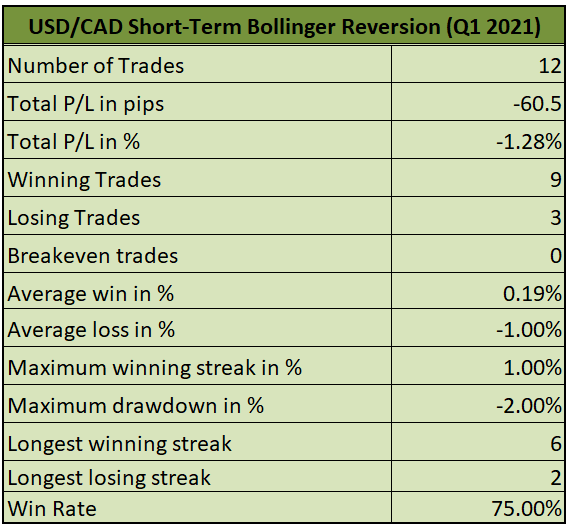
This pair had several signal-free weeks throughout the period, leading to fewer trades taken for Q1.
While some of its metrics like the 75% win rate and six-trade winning streak look impressive, its weak spot of lower average wins vs. average losses proved to be its downfall for the quarter.USD/CAD wound up with a 1.28% dent or a 60.5-pip loss for Q1 2021.
Did CAD/CHF fare any better? Here are the numbers:
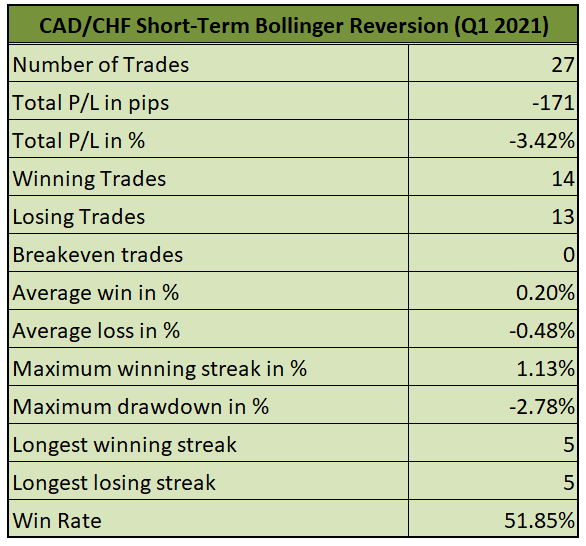
More signals, more losses for this one!
Unlike its positive run in Q4 2020, CAD/CHF wound up with a nasty 171-pip or 3.42% loss this time.Its win rate ain’t looking too good either at 51.85% while its average win of 0.20% paled in comparison to its average loss of 0.48%.
It had the same amount of trades in its longest winning streak as its longest losing streak, but the former only chalked up 1.13% in gains while the latter saw a 2.78% loss.
All in all, the Short-Term Bollinger Reversion Strategy 2.0 was down 231.5 pips or 4.70% in Q1 2021.
Not the best start to the year, huh?