


New year, new system! I’ve been getting plenty of requests for mean reversion strategies, so I came up with this simple short-term mechanical system.
To start off, I figured that using Bollinger Bands would work for mean reversion as price tends to bounce between those dynamic support and resistance levels.
As discussed in our School of Pipsology, this “Bollinger Bounce” technique is best applied in ranging market conditions. And if there’s one pair that has a strong tendency to move sideways, it’s USD/CAD!
To filter out a potential “Bollinger Squeeze” or breakout signals, I’ve decided to add the RSI as an indicator for overbought or oversold conditions, which could give the strategy better odds for catching a bounce off the bands.
For entries, I’ll be on the lookout for long-tailed candlesticks to test the support or resistance levels as additional cues for potential short-term bounces.Since this is mainly a mean reversion system, I’ll be conservative with my initial profit target in the middle of the bands while setting the ultimate target at the opposite band.
Of course, I’ll be adjusting my stop to entry once the first target is hit.
To sum up, here are the components:
Technical Indicators
- Bollinger Bands (exponential, length 50, deviation 2.00, applied to the close)
- 50 EMA as the Middle Band
- RSI (length 9, applied to the close)
Entries
- Short: If the signal candle high is greater than or equal to the top Bollinger Band AND the signal candle close is less than the top Bollinger Band AND RSI is above 75, short at the open of the next candle.
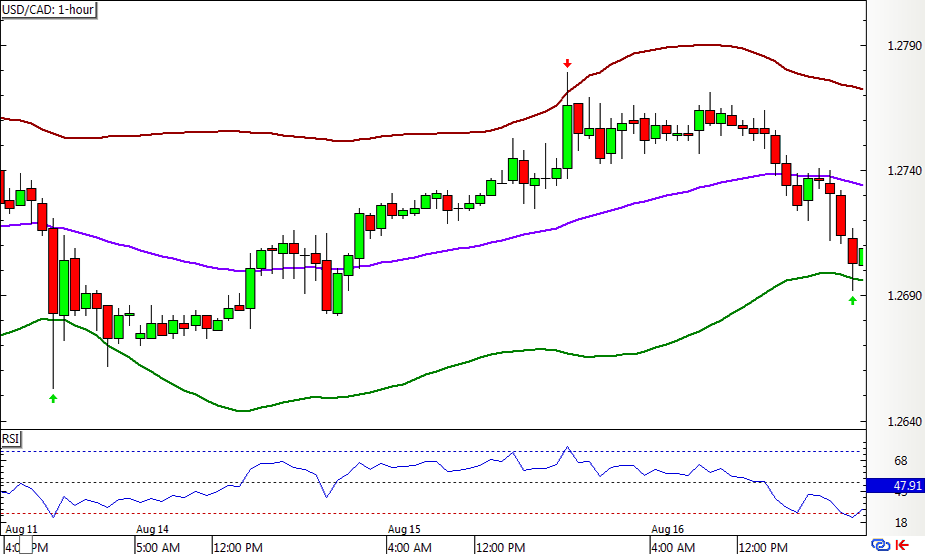
- Long: If the signal candle low is less than or equal to the bottom Bollinger Band AND the signal candle close is above the bottom Bollinger Band AND RSI is below 25, go long at the open of the next candle.
Exits
- Initial stop loss: 50 pips above the signal candle high
- Initial profit target: Close half the position at the open of the next candle after the first touch of the middle band
- Full profit target: Close the rest of the position at the open of the next candle after the first touch of the opposite band
- Adjusted stop loss: Trail stop to entry after the initial profit target is triggered
Here are a couple more examples:
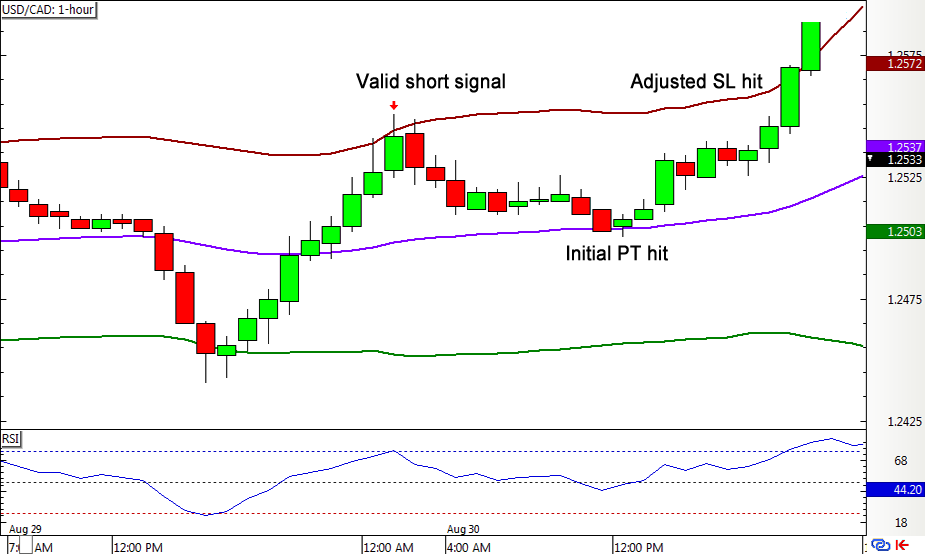
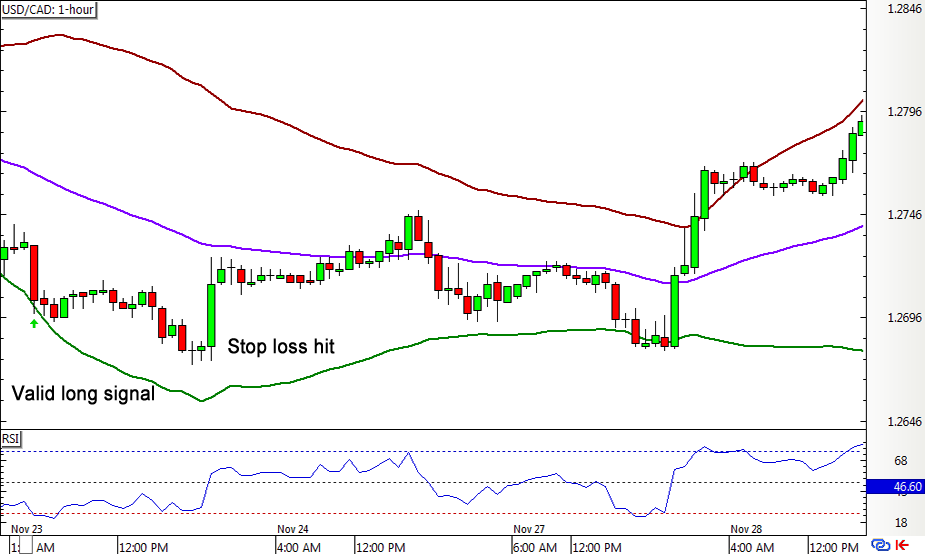
Simple enough, yes?
I’ll be running this short-term system on the 1-hour chart of USD/CAD and risking 1% of my account on each position.