


Just finished crunching the numbers for the SMA Crossover Pullback system! How did this mechanical system fare in Q4 and for the entire year?
Wondering what in the forex world I’m talking about? Make sure you look at the trading rules and risk management adjustments first. And now here are the numbers!
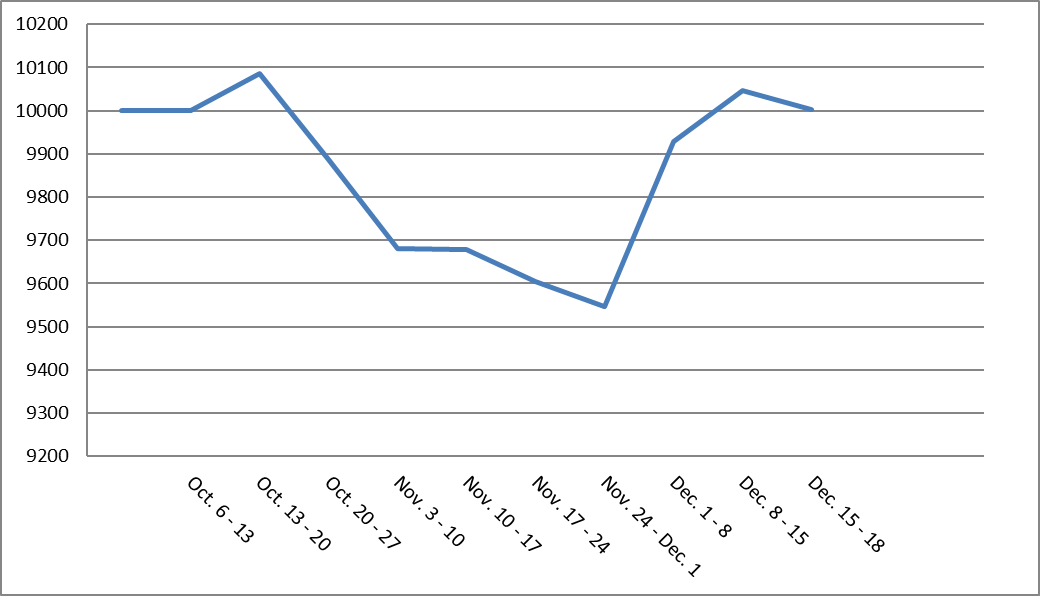
Q4 2020 SMA Crossover Pullback System Performance
| Week | P/L in Pips | P/L in % |
|---|---|---|
| Oct. 6 – 13 | 0 | 0 |
| Oct. 13 – 20 | +131 | +0.87 |
| Oct. 20 – 27 | -296 | -1.98 |
| Nov. 3 – 10 | -313 | -2.09 |
| Nov. 10 – 17 | -5 | -0.03 |
| Nov. 17 – 24 | -115 | -0.76 |
| Nov. 24 – Dec. 1 | -92 | -0.61 |
| Dec. 1 – 8 | +600 | +4.00 |
| Dec. 8 – 15 | +179 | +1.19 |
| Dec. 15 – 18 | -63 | -0.42 |
The strategy was off to a decent start as it bagged some gains in mid-October, only to give up these profits (and more!) in a five-week losing streak.
Fortunately it managed to chalk up a big weekly win when all three pairs hit their full profit targets, resulting in a 600-pip or 4% gain during the first week of December.It was able to follow through with another winning week but lost out on its latest batch of positions as early exits were triggered.
So did the system pull up to a positive finish overall?
Why, yes it did!
Unlike in the previous quarter, this mech system was able to stay in the black for Q4 2020… but only by a few pips!
It closed out with a measly 26-pip or 0.17% win for the period.
Looking further back at the system’s performance in Q1 (-351 pips / -0.44%), Q2 (+181 pips / +1.03%), and Q3 (-545 pips / -2.67%) reveals that it wasn’t able to pull off a strong run this year.
Instead, the SMA Crossover Pullback system wound up with a 689-pip or 1.91% loss for 2020. Not the best year would be an understatement!