


Finally finished crunching the numbers for the SMA Crossover Pullback system! How did this mechanical system fare in the last three months?
Wondering what in the forex world I’m talking about? Make sure you look at the trading rules and risk management adjustments first. And now here are the numbers!
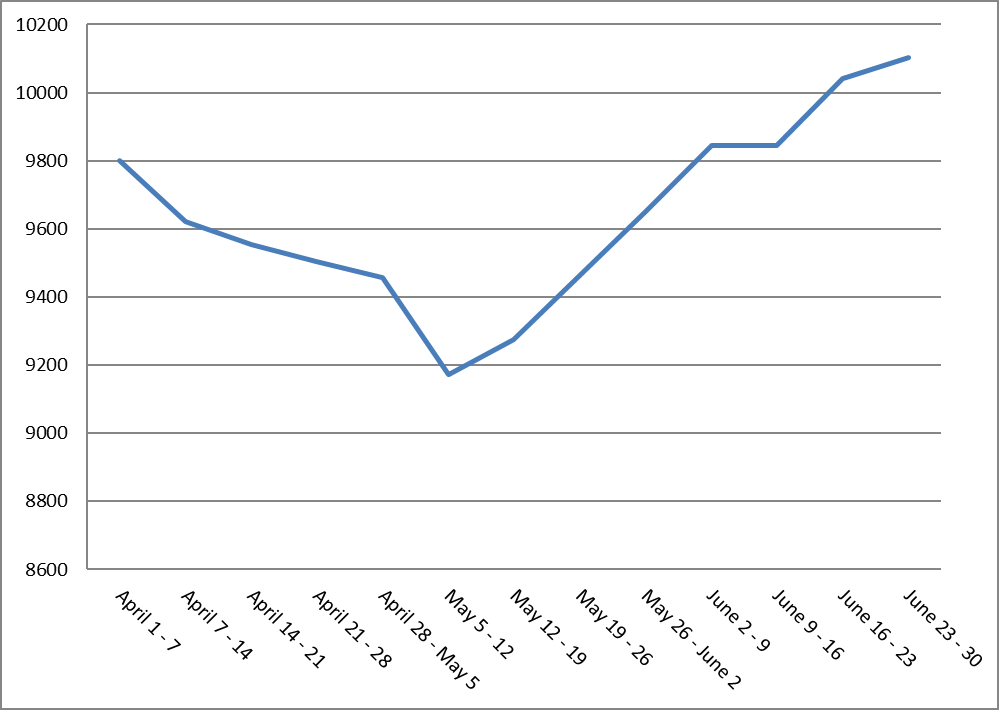
Q2 2020 SMA Crossover Pullback System Performance
| Week | P/L in Pips | P/L in % |
|---|---|---|
| April 1 – 7 | -300 | -2.00 |
| April 7 – 14 | -275 | -1.83 |
| April 14 – 21 | -102 | -0.68 |
| April 21 – 28 | -81 | -0.54 |
| April 28 – May 5 | -75 | -0.50 |
| May 5 – 12 | -450 | -3.00 |
| May 12 – 19 | +170 | +1.13 |
| May 19 – 26 | +300 | +2.00 |
| May 26 – June 2 | +300 | +2.00 |
| June 2 – 9 | +300 | +2.00 |
| June 9 – 16 | – | – |
| June 16 – 23 | +300 | +2.00 |
| June 23 – 30 | +94 | +0.62 |
As you can see from the table above, the mech system was off to a terrible start for the quarter as it logged in consecutive weekly losses until mid-May.
From there, the system turned a corner as trends started picking up. It was able to chalk up FOUR consecutive weekly wins until the second week of June, followed by a couple more weeks in the black before the period came to a close.So did the turnaround in the second half of the quarter make up for the earlier losses?
Why, yes it did!
The system was able to bag a total of 181 pips for Q2 2020, racking up to 1.03% in gains.
Looking further back reveals that the SMA Crossover Pullback System has actually been able to recover from its losses in the first quarter of the year!
Think the strategy can keep up its good run for the next few months?