


Finally finished crunching the numbers for the SMA Crossover Pullback system! How did this mechanical system fare in the last three months?
If you’ve been keeping tabs on this strategy lately, you’d probably know how it had some trouble keeping up with quick shifts in direction early during the quarter. However, some of the big wins, later on, made up a bit for those losses.
Wondering what in the forex world I’m talking about? Make sure you look at the trading rules and risk management adjustments first. And now here are the numbers!
| Week | P/L in Pips | P/L in % |
|---|---|---|
| Jan. 1 – 7 | -44 | -0.29 |
| Jan. 7 – 14 | -210 | -1.39 |
| Jan. 14 – 21 | -31 | -0.20 |
| Jan. 21 – 28 | -31 | -0.20 |
| Jan. 28 – Feb. 4 | -179 | -1.19 |
| Feb. 4 – 11 | -83 | -0.55 |
| Feb. 11 – 18 | -175 | -1.16 |
| Feb. 18 – 24 | 0 | 0 |
| Feb. 24 – Mar. 3 | -78 | -0.52 |
| Mar. 3 – 10 | +314 | +2.09 |
| Mar. 10 – 17 | -150 | -1.00 |
| Mar. 17 – 24 | +307 | +4.04 |
| Mar. 24 – 31 | +9 | +0.06 |
Calling the start of the quarter a shaky one might be a bit of an understatement!
The strategy kept digging a hole with back-to-back weekly losses all the way until March before it snagged a few big wins.Unfortunately, those winning positions weren’t enough to put the system back in the black as it wound up with a total of 351 pips in losses or a 0.44% dent on the account for Q1 2020.
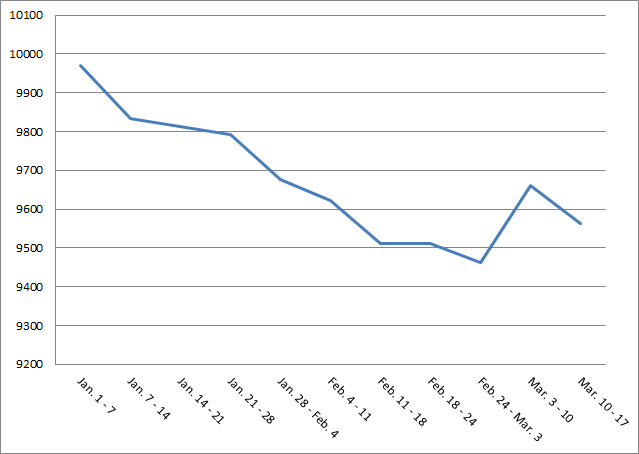
Looking further back reveals that the SMA Crossover Pullback System has already been struggling since the latter part of the previous year.
Think I should start making adjustments or just stick it out now that volatility appears to be improving these days?