


The numbers are in!
See how this mechanical trend-following trading system fared in the second quarter of this year.
Wondering what in the forex world I’m talking about? Make sure you look at the trading rules and risk management adjustments first. And now here are the numbers!
Q2 2021 SMA Crossover Pullback System Performance
| Week | P/L in Pips | P/L in % |
|---|---|---|
| Mar. 31 – Apr. 6 | +9 | +0.06 |
| Apr. 7 – 13 | -21 | -0.14 |
| Apr. 13 – 20 | -21 | -0.14 |
| Apr. 20 – 27 | 0 | 0 |
| Apr. 27 – May 4 | -51 | -0.34 |
| May 4 – 11 | +10 | +0.09 |
| May 11 – 18 | +19 | +0.13 |
| May 18 – 24 | +68 | +0.46 |
| May 24 – June 1 | +90 | +0.60 |
| June 1 – 8 | -16 | -0.11 |
| June 8 – 15 | +12 | +0.08 |
| June 15 – 22 | +900 | +6.00 |
| June 22 – 28 | 0 | 0 |
| June 28 – 30 | -103 | -0.68 |
After a pretty solid run in Q1, the strategy was off to a bit of a slow start for the quarter.
Most weeks in April and May saw sideways price action, leading to a bunch of new moving average crossovers. While some of these early exits snagged losses, there was a handful that caught decent gains.Trends started picking up again in late May and through most of June, eventually leading to a big triple win on the third week of the month. That’s 900 pips or 6.00% yo!
Even though the system ended up with a loss on the last week of June, it still managed to chalk up a positive finish.
The SMA Crossover Pullback System was able to bag 896 pips or 6.00% for Q2 2021, adding to the 212 pips or 1.40% in the previous period.
For those who prefer a more visual representation of the system’s performance, here’s an equity curve.
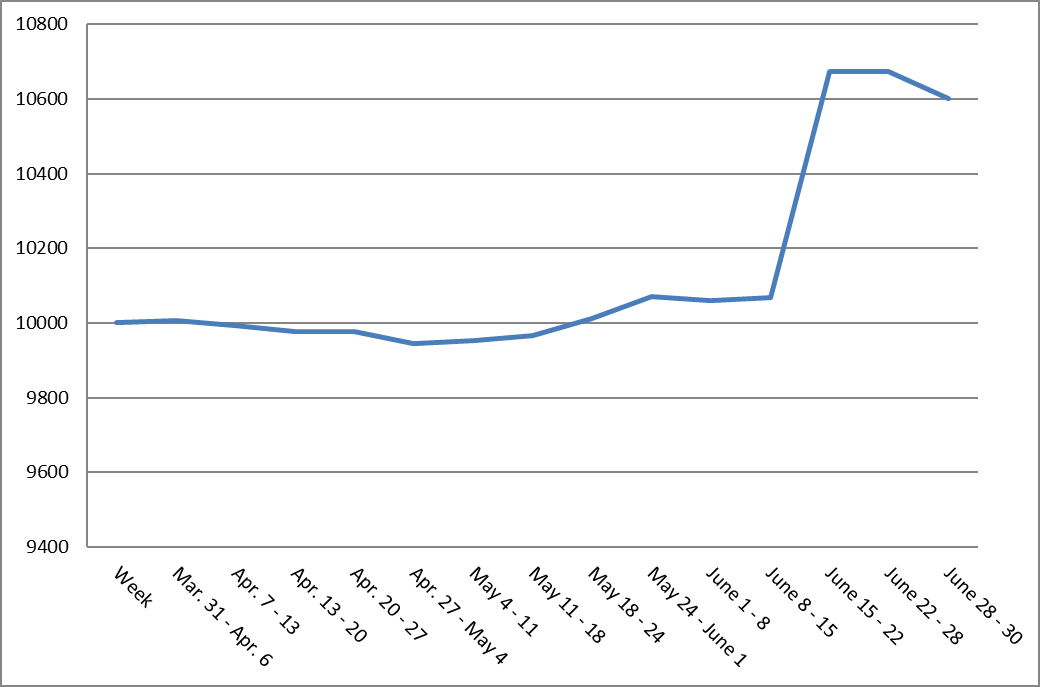
This brings the strategy up by 1,108 pips or around 7.40% for the first half of the year. Looking good, eh?
That’s enough to make up for the system’s losses for the entire 2020! Gonna keep my robot fingers crossed that it keeps up for the rest of this year!