


The numbers are in! See how this mechanical trading system fared in the first three months of this year.
Wondering what in the forex world I’m talking about? Make sure you look at the trading rules and risk management adjustments first. And now here are the numbers!
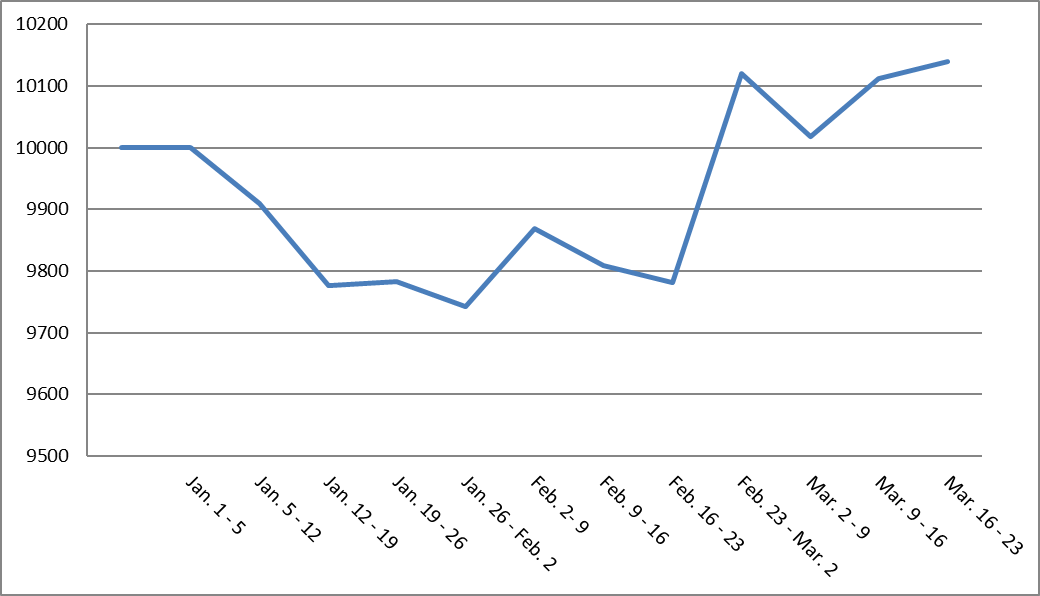
Q1 2021 SMA Crossover Pullback System Performance
| Week | P/L in Pips | P/L in % |
|---|---|---|
| Jan. 1 – 5 | 0 | 0 |
| Jan. 5 – 12 | -135 | -0.90 |
| Jan. 12 – 19 | -201 | -1.34 |
| Jan. 19 – 26 | +9 | +0.06 |
| Jan. 26 – Feb. 2 | -62 | -0.41 |
| Feb. 2- 9 | +195 | +1.30 |
| Feb. 9 – 16 | -93 | -0.62 |
| Feb. 16 – 23 | -43 | -0.27 |
| Feb. 23 – Mar. 2 | +517 | +3.45 |
| Mar. 2 – 9 | -150 | -1.00 |
| Mar. 9 – 16 | +133 | +0.93 |
| Mar. 16 – 23 | +42 | +0.28 |
| Mar. 23 – 30 | 0 | 0 |
The strategy was off to a very rough start this year, as it snagged back-to-back weeks of huge losses.
It caught a good break during the first week of February, thanks to wins on Cable and EUR/JPY. Both pairs caught early exits but still managed to bag some pips!After another couple of weeks’ worth of losses, the system enjoyed another huge win of 517 pips in late February. This came from full wins on EUR/JPY and GBP/USD, making up for a loss on EUR/USD.
From there, the strategy chalked up one more losing week and another back-to-back positive run.
So did the system pull up to a positive finish overall?
Why, yes it did!
The SMA Crossover Pullback System was able to bag 212 pips or 1.40% for Q1 2021… Not bad, eh?
This strong start doesn’t quite make up for the system’s loss in 2020, but I’m hopeful forex market trends will last longer this year!