


It’s time to take a look at the numbers for this mechanical trading system in Q4. Did the strategy end up positive overall this year?
In this revised version of the Short-Term Bollinger Reversion Strategy, I’m waiting for RSI to cross above or below oversold or overbought levels to indicate a bit more momentum in the direction of the trade.
Make sure you review the tweaks here.
And I know I haven’t really covered the position sizing rules for this system just yet but, for simplicity’s sake, I decided to assume a 1% risk per trade in order to help me analyze total performance.
Since I’m running this strategy on a per pair basis, I crunched the numbers for USD/CAD first:
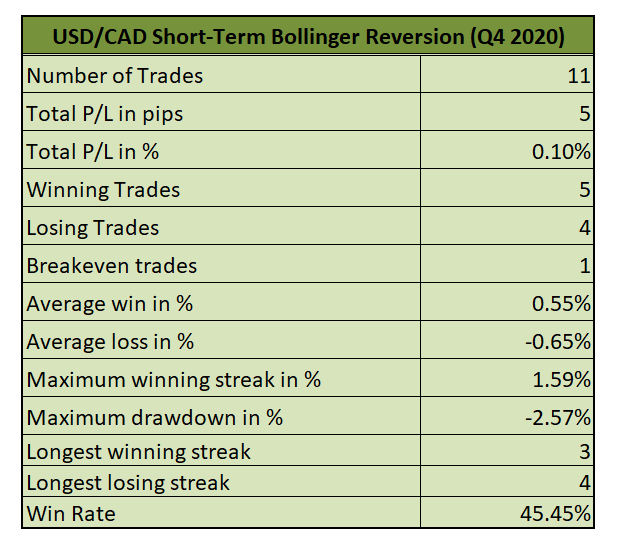
This pair had fewer trades compared to the previous quarter and its total P/L of 0.10% pales in comparison to the earlier period’s 7.77% gain.
While its 45.45% win rate is slightly better than that of Q2, it’s also much lower compared to the previous 93.33% figure.Its average win of 0.55% is a bit smaller than the 0.65% average loss, and the pair also had a much larger maximum drawdown.
Did CAD/CHF fare any better? Here are the numbers:
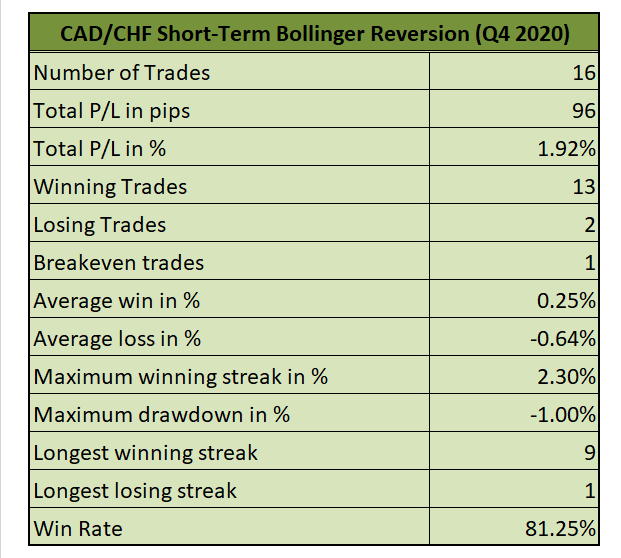
Unlike in the previous quarter, this pair performed much better than the other, scoring an impressive 1.92% gain or 96 pips.
That’s higher compared to its 1.58% gain for Q2 but still behind its Q1 performance.Still, it’s worth noting that its win rate stands at a nice 81.25% while chalked up a pretty impressive nine-trade winning streak from October to November.
All in all, the Short-Term Bollinger Reversion Strategy 2.0 was up 101 pips or 2.06% for Q4 2020, enough to bring the system up 1,231.5 pips or 24.67% for the year. Now that’s a pretty decent run in my book!