


Start your trading prep with a review of last week’s price action and an overview of catalysts coming up.

Take a look at how the majors performed recently and the upcoming catalysts to watch out for:
Major FX Pairs Overview

USD
The Greenback managed to chalk up a positive week as traders sought the safety of lower-yielding currencies while focusing on pandemic-related updates.
The U.S. economy has a data dump coming up this week ahead of the highly-anticipated September NFP release on Friday. Read more.
CAD
It was a mixed run for the Loonie as counter currency flows came in play during a data-light week in Canada.
Only the monthly GDP is up for release this time, which means that the Canadian currency might keep taking cues from crude oil prices and market sentiment. Read more.
EUR & CHF
Both European currencies failed to take advantage of a pickup in risk aversion since traders were wary of rising COVID-19 cases in the region.
ECB head Lagarde has a couple of speeches that might be worth keeping tabs on early in the week. Apart from that, there are no major catalysts scheduled from the eurozone or Swiss economy. Read more.
GBP
Sterling was off to a rough start but staged quite the comeback midweek as Brexit talks turned a corner.
Formal trade negotiations are set to resume this week, and officials are gearing up for a crucial vote on the Internal Market bill. Read more.
JPY
Yen bulls turned out to be big winners as the lower-yielding Japanese currency took advantage of risk-off flows for the most part.
There are no major reports coming up from the Japanese economy this week, so it could be all about market sentiment once again. Read more.
AUD
The Aussie spent the week mostly in the red as risk sentiment soured on account of pandemic concerns and dovish RBA commentary.
PMI readings are up for release from Australia’s top trade partner China, along with low-tier reports that could bring some volatility for AUD pairs. Read more.
NZD
The Kiwi also reeled from downbeat central bank commentary and risk-off flows stemming from the rising number of COVID-19 cases.
There’s not much in the way of top-tier catalysts for New Zealand, which leaves counter currency action and risk sentiment as primary drivers. Read more.
Forex Charts to Watch:
EUR/AUD: 4-hour
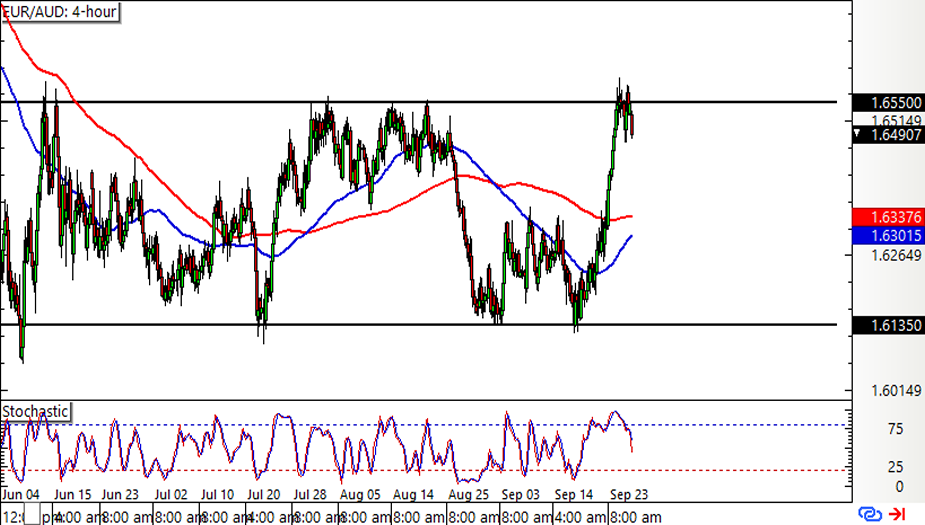
Bounce or break?
EUR/AUD is hanging out at the top of its range visible on the 4-hour chart, testing resistance at the 1.6550 minor psychological mark.If the ceiling holds, the pair could slip back to the bottom of the range at 1.6135. An upside break, on the other hand, could be followed by a rally that’s the same height as the rectangle pattern.
Stochastic is pointing down to hint that sellers are ready to take over, but the narrowing gap between the moving averages suggests that bullish momentum might pick up.
EUR/NZD: 4-hour
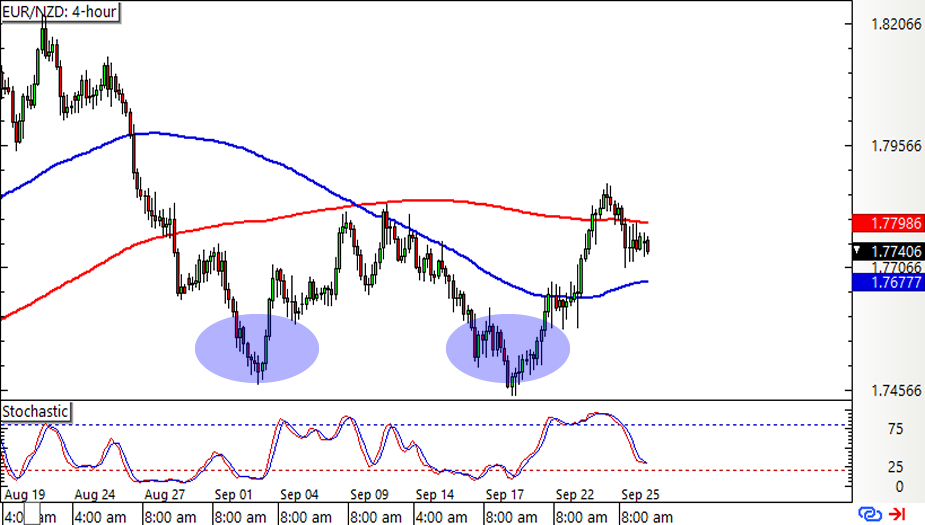
Reversal alert!
EUR/NZD failed in its last two attempts to break below the 1.7450 minor psychological mark, creating a double bottom pattern on its 4-hour chart.A break past the neckline resistance around the 1.7800 mark could confirm that an uptrend of the same size as the formation is in order. However, Stochastic is still heading lower, so price might keep following suit while bearish pressure is present.
Note that the 100 SMA is also below the 200 SMA to signal that the path of least resistance is to the downside or that resistance is more likely to hold than to break. In that case, a move back to the bottoms might still be possible!
EUR/CAD: 1-hour
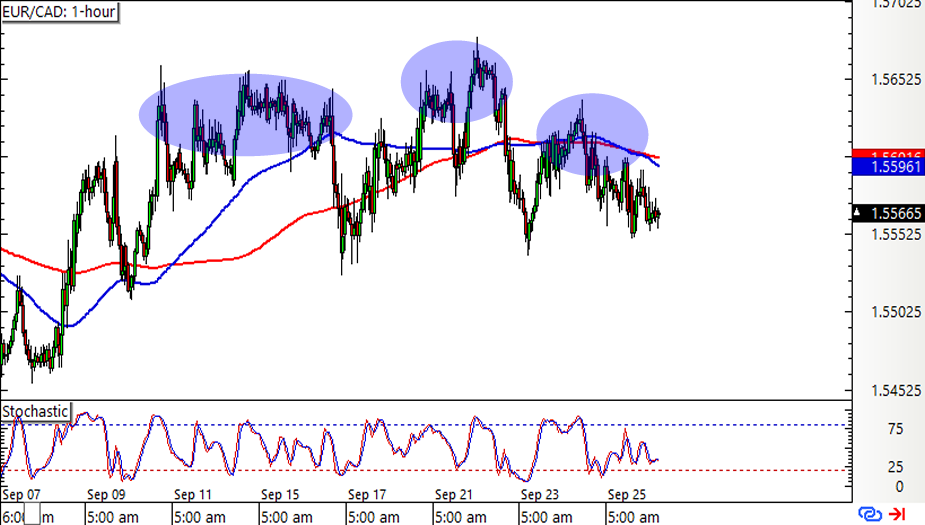
Not a fan of the euro? Here’s another potential reversal play that’s bearish for the shared currency!
EUR/CAD has formed a head and shoulders pattern on its 1-hour time frame and looks ready to break below the neckline support at 1.5550.If that happens, a downtrend that’s at least the same size as the chart pattern could follow. Stochastic is barely offering directional clues as it moves sideways, but a bearish moving average crossover appears to be forming!