


Both pairs I’m watching on this system got a couple of signals each this week, and some hit their full targets.
How many pips did it catch?
In this revised version of the Short-Term Bollinger Reversion Strategy, I’m waiting for RSI to cross above or below oversold or overbought levels to indicate a bit more momentum in the direction of the trade.
Make sure you review the tweaks here.
USD/CAD was trending higher during the first part of the week when it snagged a short play on a test of the top Bollinger Band.
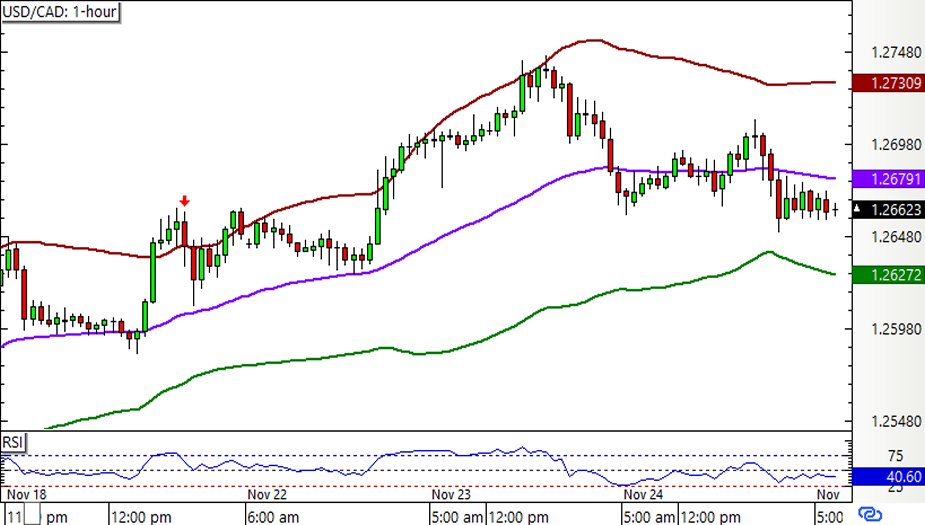
The pair dipped close to the first target at the middle band, but unfortunately missed.
Instead, it carried on with its climb and snagged the stop loss in the process. Ouch!With that, USD/CAD wound up with a full 1% loss for the week.

Meanwhile, CAD/CHF was rangebound for the most part of the week, and it caught a couple of valid long signals.
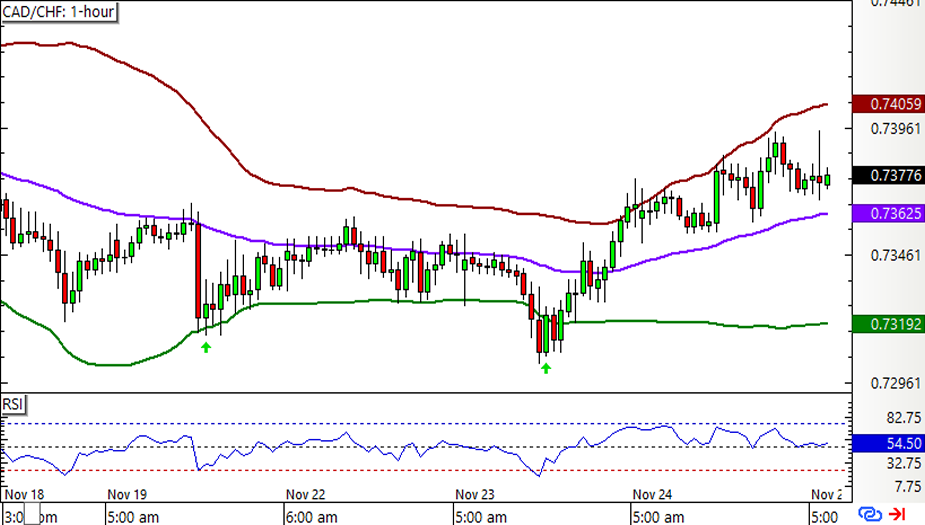
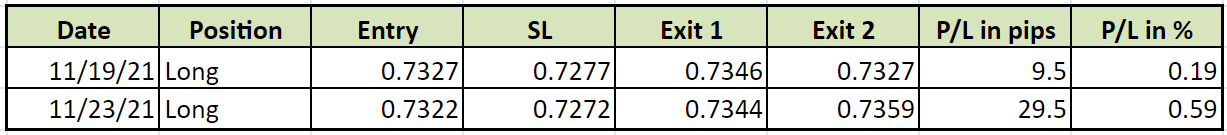
The first long position made it to the first PT at the middle band, before the remaining half had to be closed at the adjusted SL to entry.
The next long position bounced all the way up to the full target at the top band, scoring 29.5 pips in total.
This was enough to bring CAD/CHF up by 39 pips or 0.78% for the week:
This leaves the Short-Term Bollinger Reversion Strategy down by 11 pips or 0.22%, erasing earlier gains and more.
Not exactly the best of runs for this system lately, huh?
Seen how the numbers turned out for Q3 2021 yet?