


Both pairs I’m watching on this system were trading sideways throughout the week.
Did it catch any winning plays?
In this revised version of the Short-Term Bollinger Reversion Strategy, I’m waiting for RSI to cross above or below oversold or overbought levels to indicate a bit more momentum in the direction of the trade.
Make sure you review the tweaks here.
USD/CAD had a short position left open from the previous week. This already hit the first target at the middle band while the remaining half was running risk-free.
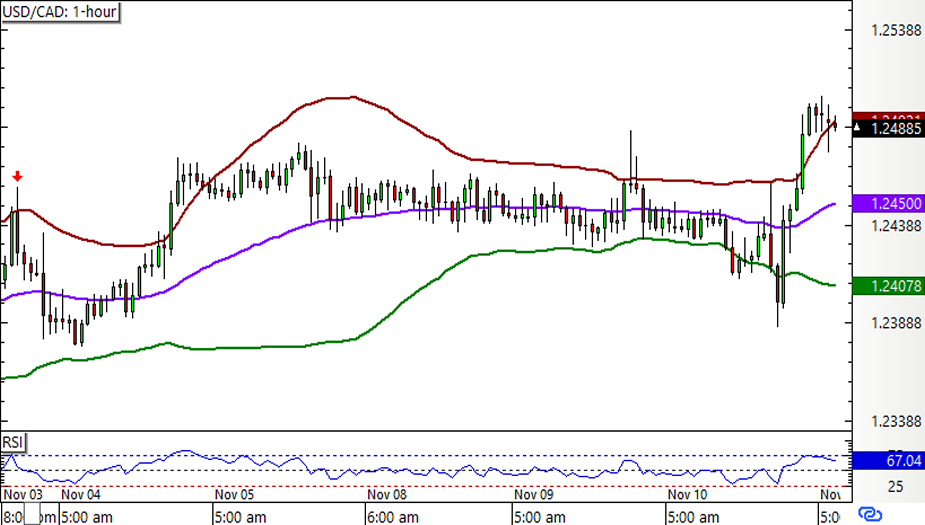
Unfortunately price didn’t reach the opposite band to secure a full win, retreating back to the entry price to close the rest of the position at breakeven instead.
The pair moved in a tight range for the most part of the week before volatility eventually picked up.No new signals were generated, though, so USD/CAD is closing out with a 16-pip or 0.32% gain:

Meanwhile, CAD/CHF also traded inside a range throughout the week, but it didn’t test the Bollinger Bands until much later on.
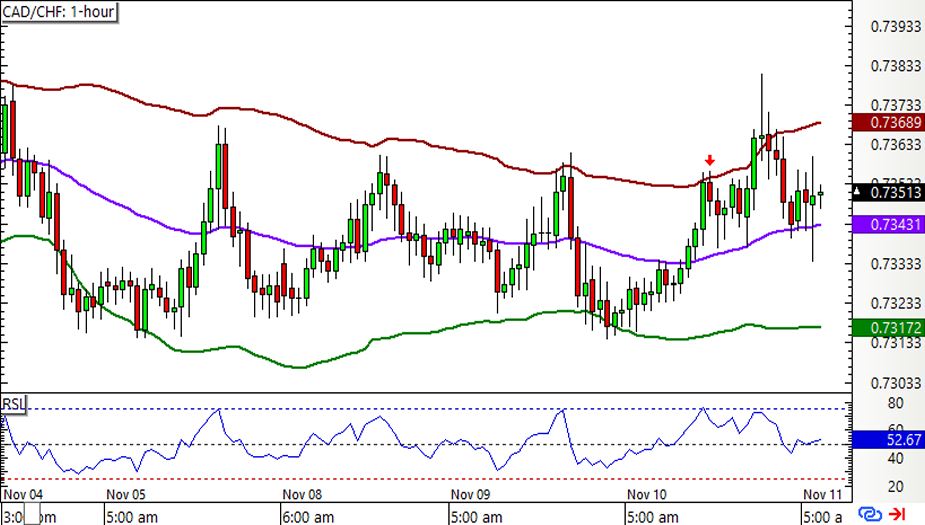
The pair bounced off the top and bottom band mid-week but RSI didn’t really generate any fresh signals then.
CAD/CHF finally managed to catch a short signal before the week ended, and this bagged some gains when it hit the first target.
The rest of the position was closed out at breakeven.

All in all, the Short-Term Bollinger Reversion Strategy is up by 18.5 pips or 0.37% for the week, making up for earlier losses.
Seen how the numbers turned out for Q3 2021 yet?