


Both USD/CAD and CAD/CHF moved sideways for a good part of this week, so the strategy caught a handful of valid signals.
Did these turn out winners?
In this revised version of the Short-Term Bollinger Reversion Strategy, I’m waiting for RSI to cross above or below oversold or overbought levels to indicate a bit more momentum in the direction of the trade.
Make sure you review the tweaks here.
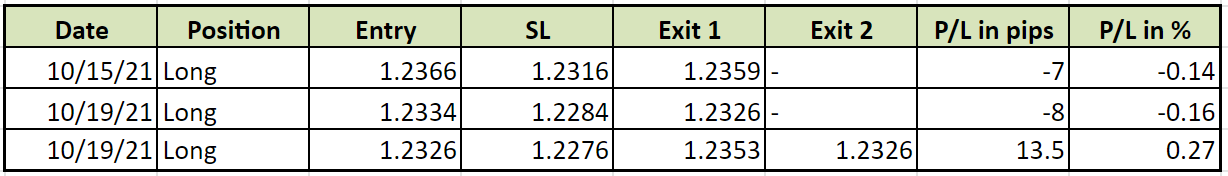
USD/CAD was trading at the bottom half of the Bollinger Bands throughout the week, and it caught three valid signals off those bounces.
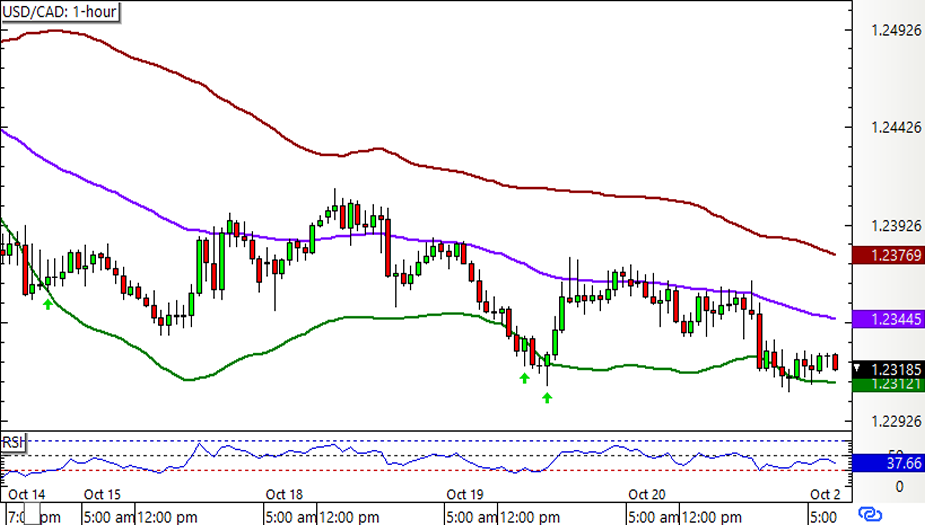
The first one was able to reach the first target at the middle band, but unfortunately the next candle opened at a price lower than entry.
The next long play didn’t stay open for very long since another bullish signal appeared after a couple of bars.
The third position did fairly well, as it was able to score a decent gain from the first PT at the middle band before the remaining half was closed at entry.However, the wins weren’t enough to make up for the earlier losses, so USD/CAD ended up with a 1.5-pip or 0.03% loss:
Meanwhile, CAD/CHF was moving sideways the entire week but didn’t really test the top or bottom bands until the latter half.
The pair picked up on a long signal when it tested the lower Bollinger Band, and price popped up to the top band almost immediately.
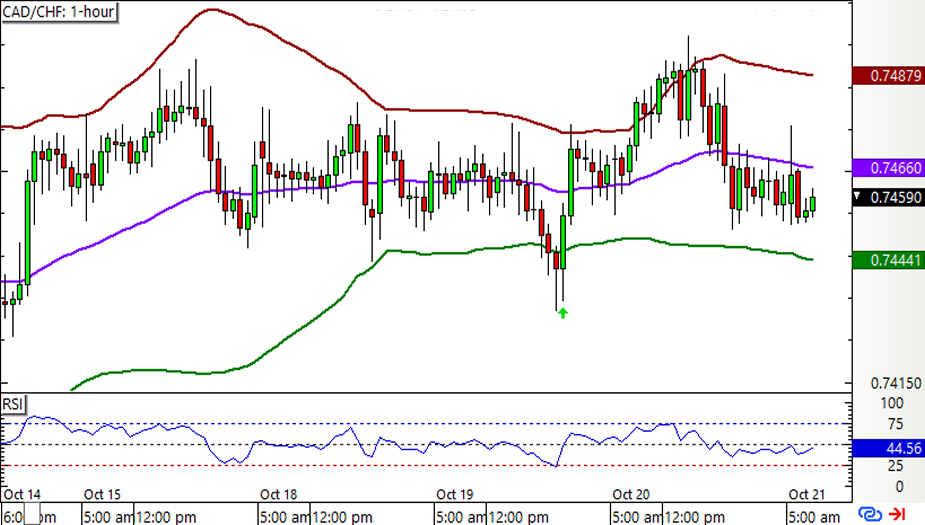
This closed the position entirely, bagging 16 pips or a 0.32% gain for the pair.
I know it’s not much, but at least it makes up for USD/CAD’s dent and erases some of CAD/CHF’s losses last week.

All in all, the Short-Term Bollinger Reversion Strategy is up by 14.5 pips or 0.29% for the week.
It’s still not the best of starts for this quarter, as the system is still reeling from a very shaky start.
Seen how the numbers turned out for Q3 2021 yet?