


Terra (LUNA) has been on fire in December, bucking the recent negative broad market risk trends stricken by pandemic and monetary policy fears. What’s driving LUNA to all-time highs and can the party keep going?
LUNA/USD 4-Hour
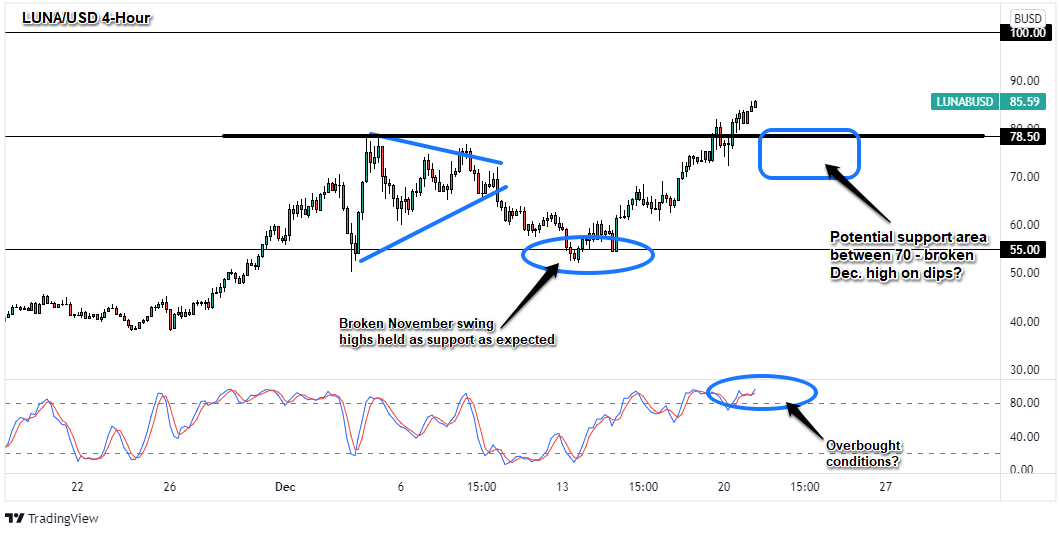
Almost two weeks ago, we highlighted a symmetrical triangle formation on Terra (LUNA), a pattern that could lead to both bullish and bearish price action depending on how the broad market and Terra’s narrative played out. It looks like that pattern lead to a downside break as LUNA moved with the broad market lower thanks to rising Omicron variant fears.
This was one of the scenarios we discussed and if it did play out, then $55.00 was the level watch (the previous all-time high area struck in early November) as any downside moves would likely be held by traders and investors looking for dips to play the strong fundamental story behind Terra’s growth.
It looks like that scenario played out as expected as $55 held twice last week before LUNA/USD shot up higher with barely a hiccup these past few trading sessions. This was something to watch as the broad crypto space lagged while Terra continued to make new all-time highs, gaining +65% over the past seven days.
It appears that with this kind of price action and as Terra’s ecosystem hits new milestones (e.g., UST overtakes DAI as the no. 4 stablecoin by marketcap, Terra becomes the second largest blockchain by total value locked behind Ethereum, LUNA becomes a top 10 crypto asset by marketcap), the world is now starting to take notice of Terra. According to the crypto social intelligence site Lunarcrush.com, Terra jumped to the top 20 tokens in terms social volume and top 10 in social engagement.
With the narrative of decreasing supply (the community is still burning LUNA to mint UST, and LUNA supply being locked up in new protocols), a fast growing ecosystem of innovative DeFi apps, and more chatter on LUNA on social media, the rise in price to now above $85 is not unexpected, and the odds are pretty good the market will remain bullish with all other things being equal.
Of course, LUNA doesn’t trade in a vacuum (or does it?), so if there are any dips due to exogenous factors, then the previous broken high around $78.50 down to $70.00 is the area to watch out for any potential support pattern formations before considering new or additional longs.
A break below that area would likely draw in additional selling depending on the catalyst, and if it is a pretty strong catalyst, a retest of the $55.00 – $60.00 previous support area is not out of the question given the current volatility levels (around $9 daily Average True Range).
If there are no dips, then we could see $100 LUNA very soon if momentum holds, at which point it is likely some profit taking may occur. Something to consider if managing a LUNA position with a shorter-term mindset.
What do you all think? Will we see $100 LUNA before the end of the year or could we see a top around $90? Any potential negative catalysts ahead that we missed? Let me know in the comments section below!
This content is strictly for informational purposes only and does not constitute as investment advice. Trading any financial market involves risk. Please read our Risk Disclosure to make sure you understand the risks involved.