


Terra (LUNA) hits the top of the watchlist once again as the pair consolidates after a massive bull run. Are we in for a dip ahead or is an upside break around the corner?
Symmetrical Triangle on Terra (LUNA)
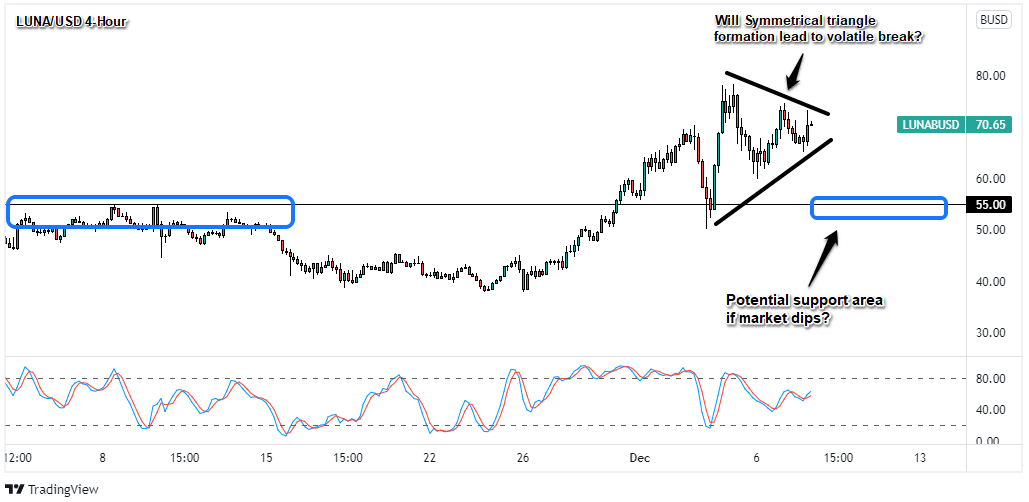
Less than two weeks ago, Terra (LUNA) was calmly trading in a range between $40 – $45 before breaking higher towards the previous all-time high around $55. We pointed out that given the strong fundamental narrative (massive UST minting and LUNA burning), a retest wouldn’t likely draw in enough sellers to reverse a bullish run and hold the $55 handle for long.
Well, that bullish run came and $55 was cut down like a hot knife through butter as LUNA/USD made it’s way higher. LUNA did suffer with the rest of the crypto asset space during last week’s broad sell-off, but amazingly, LUNA turned that into a quick buying opportunity when the market retest that $55 previous high area. Not only did LUNA get to the then $70, but broke that quickly to nearly hit $80 just a day after the broad crypto crash.
Since then, market volatility has dipped and price action seems to be drawn to the $70 handle, forming a symmetrical triangle in the process. This pattern is usually seen as both a buy or sell signal, depending on which side the market breaks.
Given that the fundamentals are still strong and as Omicron variant fears fade, an upside break would likely draw in technical buyers once again. With a daily average true range of around $8 currently, that could lead to new all-time highs, possibly a test of the $90 in a short period of time.
But if Omicron fears grow and/or inflation/rate hike fears come back into the mix, a dip in risk assets like LUNA is a likely short-term outcome. A break below the rising ‘lows’ could draw in short-term sellers/profit takers, but that move may be limited to the $55 handle once again if the fundamental story of LUNA holds strong.
What do you all think? Is LUNA set to pick up in volatility and break the triangle? Or will we see this triangle turn into more of a consolidation range ahead. Let me know in the comments section below!
This content is strictly for informational purposes only and does not constitute as investment advice. Trading any financial market involves risk. Please read our Risk Disclosure to make sure you understand the risks involved.