


As I’ve mentioned in my last posts, I’m going back to using the HLHB Trend-Catcher System on the 1-hour time frames. Luckily, my backtest results are giving me the thumbs up.
But first, read all about my HLHB Trend Catcher System if this is your first time hearing about it!
A couple of months ago I switched from using 1-hour time frames to 4-hour charts after I got a dizzying 500+ signals from EUR/USD and GBP/USD. EACH!!!
After a couple of experiments, I found that adding the ADX indicator as a filter on top of the RSI yielded the best results for the time frame that I wanted.
But while Q1 2017 and Q2 2017’s results weren’t completely terrible, they also weren’t at par with the winning trades that I had when I traded the 1-hour. What’s more, problems such as missing good, strong trends and getting fakeouts didn’t go away as effectively as I thought they would on the 4-hour charts.
I decided to backtest the current tweaks on the 1-hour charts to compare it against 4-hour results in the first half of the year. Here’s what I got:
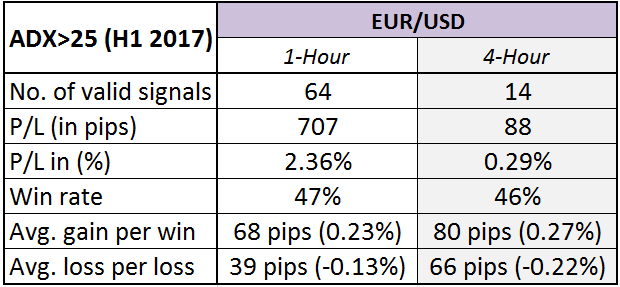
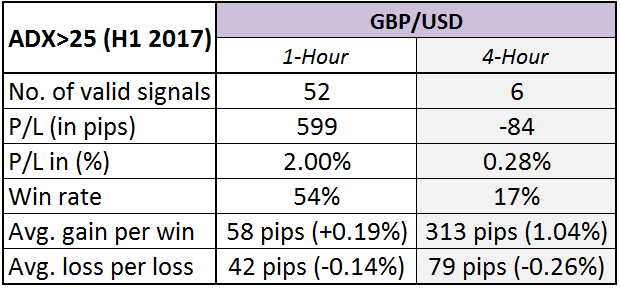
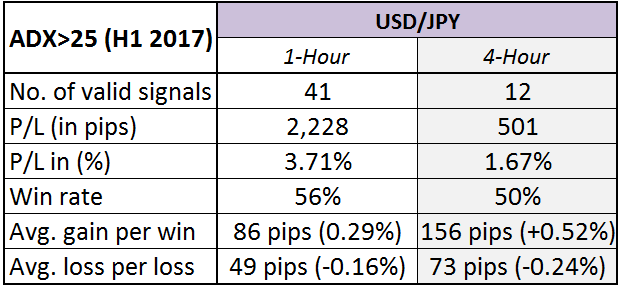
As you can see, there are really WAY more valid signals on the 1-hour charts. However, profits (both in pips and in %) are also much higher when using 1-hour charts.
One good reason for this is that the HLHB manages to catch more intraweek trends but the 150-pip trailing stop gives it enough room to move. So while the win rates are only marginally better, the average gains eclipsing average losses also make it easier for the HLHB to gain more moolah.So it looks like we’ll all be seeing more signals from the HLHB for the rest of the year. Hopefully, they also lead to better results as the backtest numebrs suggested.
Fingers crossed for trendier weeks ahead!
