


Spotted this neat long-term ascending channel setup! Is the pair due for another bounce off the channel bottom and area of interest?
NZD/CAD Trade Idea
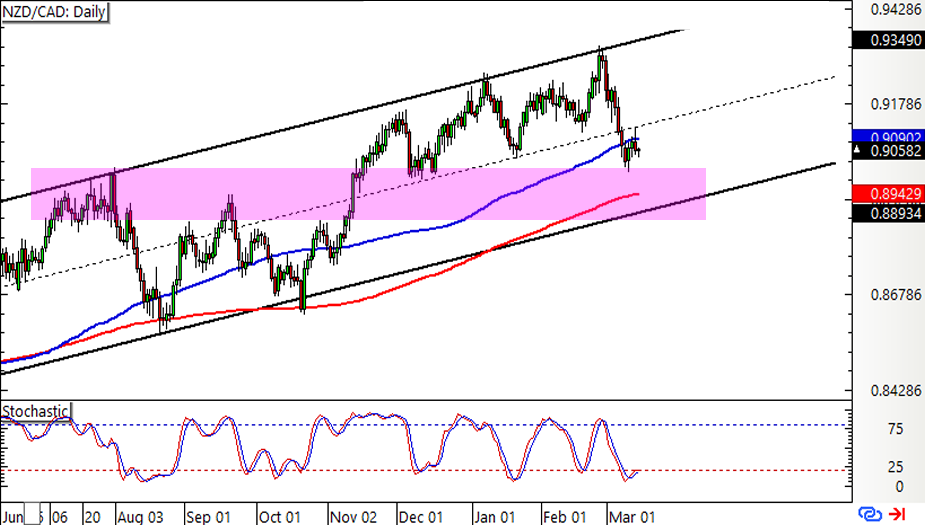
Price just recently tumbled through the mid-channel area of interest, clearing the way for a move all the way down to the bottom around the .8900-.8950 levels.
There are several ways to play this setup, depending on how the upcoming catalysts turn out:I’m considering hopping in an intraday short position if the Canadian jobs report surprises to the upside and triggers a sharp CAD rally. After all, crude oil price gains are also in favor of more gains for the oil-related currency.
Weak jobs data could be enough reason to jump in a long position and aim for the channel top, but TBH I’m more inclined to wait for a bounce off the long-term channel support.
Bulls are likely to be hanging out around this floor since it coincides neatly with a former resistance zone. Technical indicators are also hinting that buying pressure is still very much present.
For one, the 100 SMA is above the 200 SMA to suggest a continuation of the climb while Stochastic is starting to pull up from the oversold region. To top it off, the channel bottom is near the 200 SMA dynamic inflection point, which adds to its strength as support.Longer-term fundamentals could be leaning in favor of the Kiwi since New Zealand appears to be doing a better job than most developed nations when it comes to dealing with the pandemic.
This could mean an earlier return to normal business conditions for New Zealand, which might then convince the RBNZ to tighten monetary policy soon.
Do you think I should trade the news with NZD/CAD or just wait for a test of the channel support?
This content is strictly for informational purposes only and does not constitute as investment advice. Trading any financial market involves risk. Please read our Risk Disclosure to make sure you understand the risks involved.