


Both pairs I’m watching on this strategy only caught one signal each.
Did these positions at least catch any pips?
If this is the first time you’re reading about this forex strategy, I suggest you take a look at the system rules before reading on.
Also, this version makes use of an adjusted stop loss size on both USD/JPY and GBP/JPY.
The size of the stop loss was adjusted from the original 20% of the first candlestick to 40% of its length.
USD/JPY had a few inside bar patterns that formed throughout the week, but only one had its entry triggered.

This signal popped up at the start of an uptrend, so the pair was able to catch a few pips from the position.
Unfortunately it didn’t stay open long enough to catch the entire rally that followed!Still ain’t complainin’ about the 24 pips it bagged, though:

GBP/JPY also opened only one position for the week, even though it formed multiple inside bar patterns.
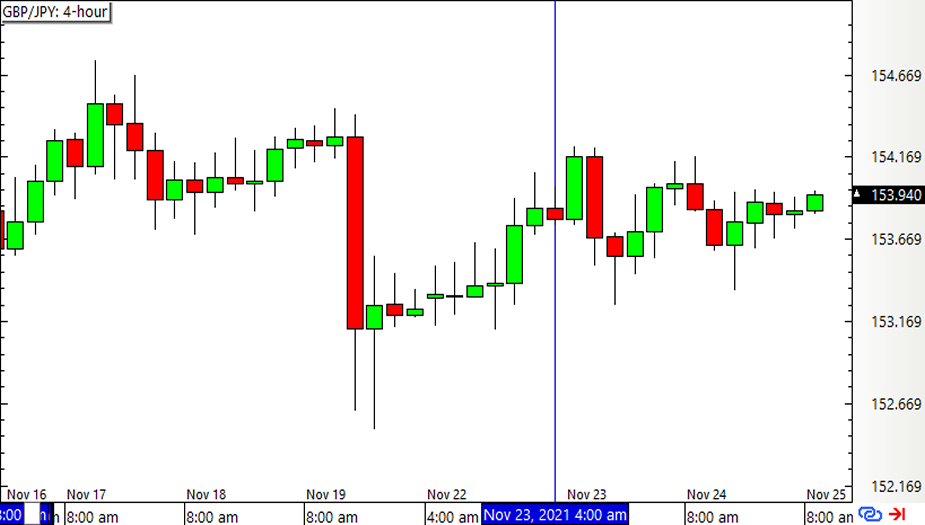
The pair was actually trading sideways for the most part, and the long play popped up towards the end of a quick rally.
Price moved slightly higher when the long position was opened, but it didn’t climb high enough to reach the PT.
Eventually it reversed course and tumbled all the way down to the stop loss. Ouch!

This brings the Inside Bar Momentum Strategy 2.0 up by a measly 5 pips for the week, barely making up for earlier losses.
The percentage win/loss depends on how position sizes are calculated.
ICYMI, see how the numbers added up for Q3 2021.