


New year, new system! I spent a good part of the holidays cooking up a pure price action-based forex mechanical strategy and I think it’s ready for tasting… I mean, testing!
As you’ve probably gleaned from its name, this trading system hunts for inside bar formations, which are dual candlestick patterns in which the second bar is completely contained by the high and low of the first bar.
These typically reflect a period of consolidation within a trend before making another strong move in the same direction, but they can also indicate potential reversals off inflection points.
Without further ado (or technical indicators and settings), here are the entry and exit rules:
Buy Signal
The first candlestick must be bullish (green or white) and if the second candlestick is completely contained by the first, set a buy stop order at the first candle’s high plus 10% of its range (high minus low).
Place the stop loss at the first candle’s high minus 20% of its range.
Set the target at the first candle’s high plus 80% of its range.
Sell Signal
The first candlestick must be bearish (red or black) and if the second candlestick is completely contained by the first, set a sell stop order at the first candle’s low minus 10% of its range (high minus low).
Place the stop loss at the first candle’s low plus 20% of its range
Set the target at the first candle’s low minus 80% of its range.
Additional rules
If another inside bar pattern forms, the current position should be closed or the pending buy/sell order must be canceled and entry orders must be updated to the latest candles.
Sound confusing?
Here are a few examples on USD/JPY’s 4-hour time frame:
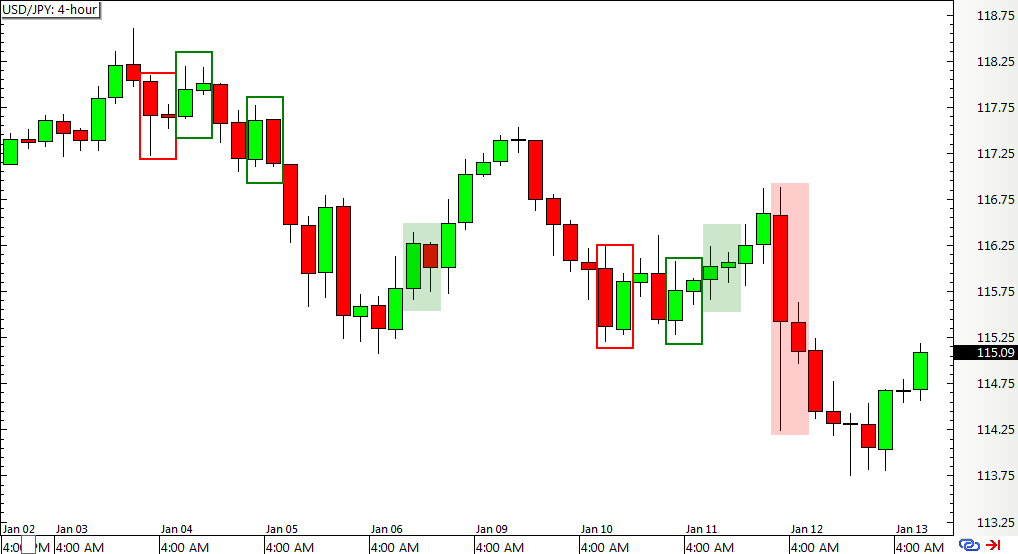
The empty red and green boxes highlight the inside bar formations whose sell or buy orders weren’t triggered while the filled ones indicate the ones with long or short positions.
It does take some time and a sharp eye to get used to spotting inside bar patterns and valid signals, but it can be a breeze once you get the hang of it!
Now let’s zoom in to the opened positions for the entry and exit levels:
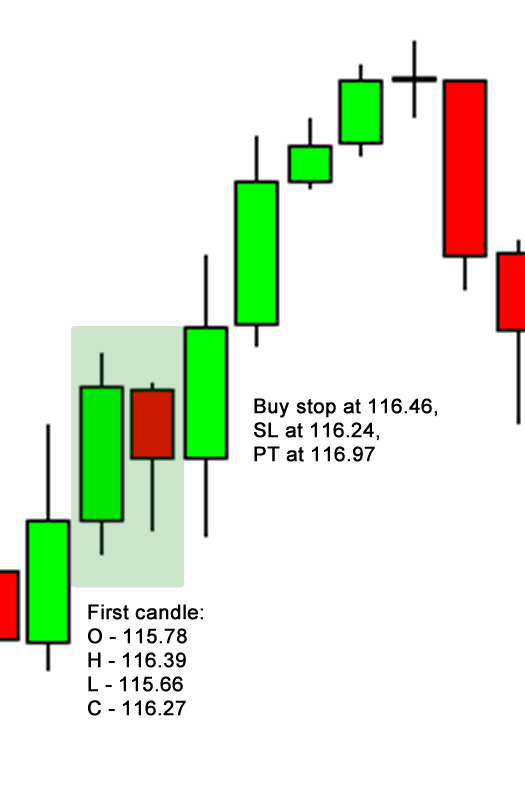
Buy stop order = 116.39 + 0.10*(116.39 - 115.66)
Stop loss = 116.39 - 0.20*(116.39 - 115.66)
Profit target = 116.39 + 0.80*(116.39 - 115.66)
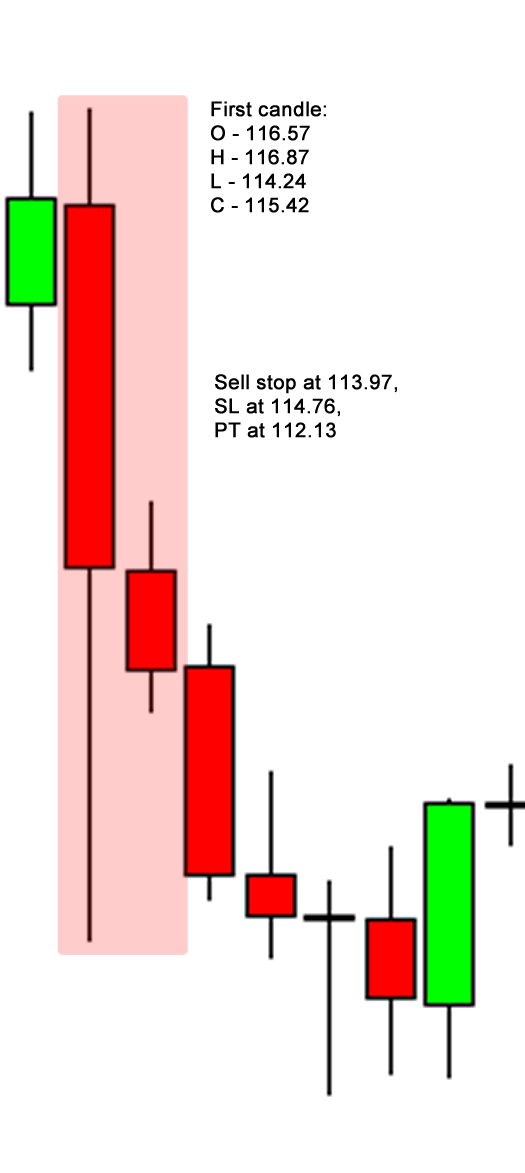
Sell stop order = 114.24 - 0.10*(116.87 - 114.24)
Stop loss = 114.24 + 0.20*(116.87 - 114.24)
Profit target = 114.24 - 0.80*(116.87-114.24)
I’m still ironing out some of the kinks of this system and might come up with more early exit rules in my next posts, but do share your initial thoughts in the comments section below!
As a practice, can you determine the entry and exit levels for the second valid long signal on January 11?