


USD/JPY caught more than its usual share of signals while GBP/JPY had only one valid play for the week.
How did these positions turn out?
If this is the first time you’re reading about this forex strategy, I suggest you take a look at the system rules before reading on.
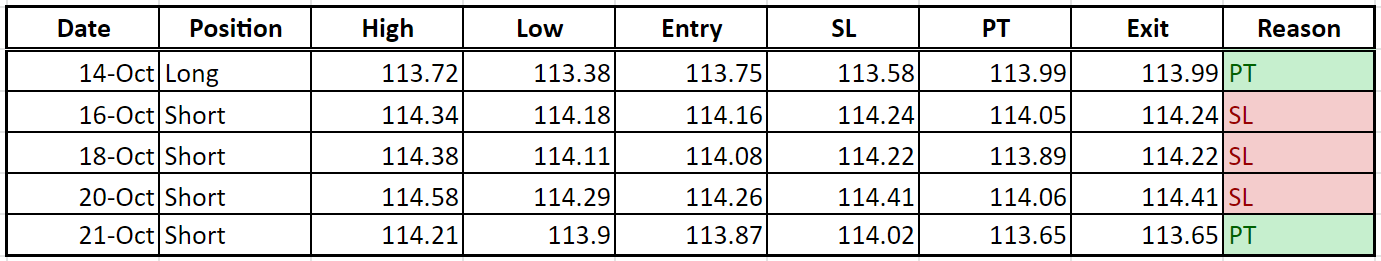
Also, this version makes use of an adjusted stop loss size on both USD/JPY and GBP/JPY.
The size of the stop loss was adjusted from the original 20% of the first candlestick to 40% of its length.
USD/JPY had a long position left open in the earlier update, and this was able to bank on bullish momentum at the start of this week.
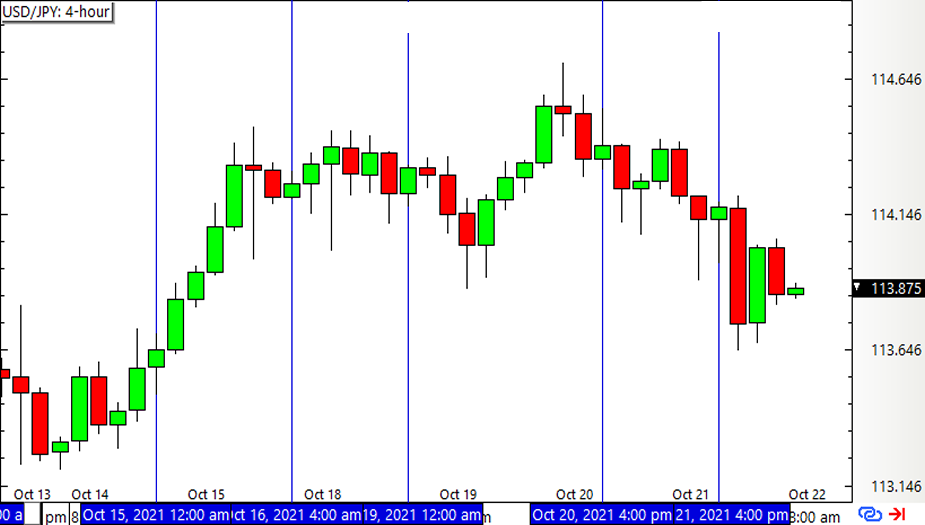
This was followed by four more valid plays, even as the pair moved sideways for the most part.
Because of these ranging conditions, USD/JPY snagged three consecutive losses. As it turned out, the stops on these were too close by that the positions were closed quickly on pullbacks.Fortunately, the last signal turned out to be a profitable one and managed to make up for some of the losses.
Here’s how the signals fared:
GBP/JPY had only one valid signal for the week, as it caught a short play towards the top of the rally.
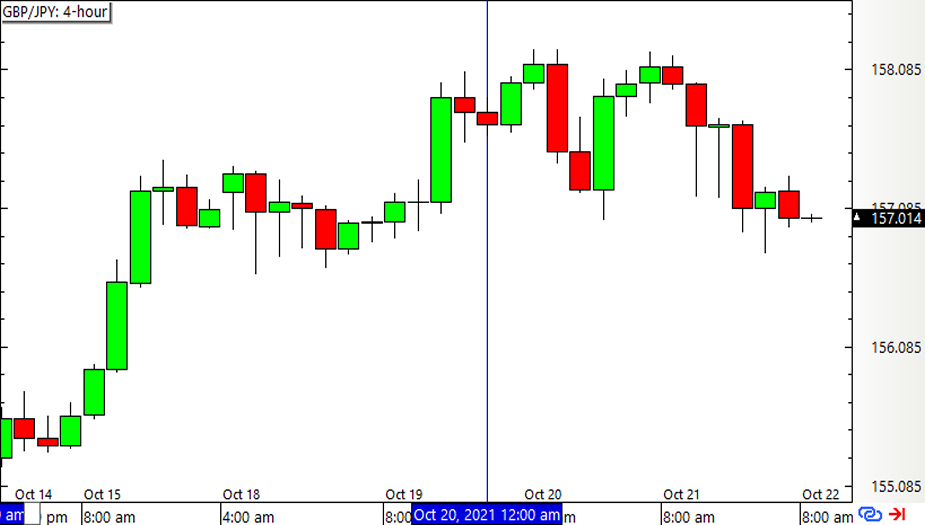
Less is more for this one, though!
The short position was able to profit from the quick selloff that took place, catching 35 pips for this pair.

This brings the Inside Bar Momentum Strategy 2.0 up by 44 pips for the week, adding to the profits from earlier this month.
The percentage win/loss depends on how position sizes are calculated.
ICYMI, see how the numbers added up for Q3 2021.