


Both USD/JPY and GBP/JPY enjoyed strong moves early in the week, but was this strategy able to ride those?
Read on to find out!
If this is the first time you’re reading about this forex strategy, I suggest you take a look at the system rules before reading on.
Also, this version makes use of an adjusted stop loss size on both USD/JPY and GBP/JPY.
The size of the stop loss was adjusted from the original 20% of the first candlestick to 40% of its length.
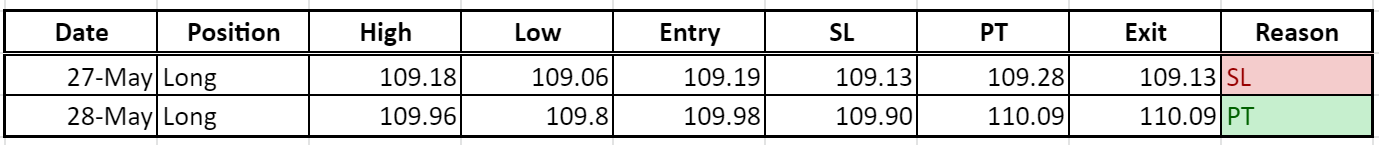
USD/JPY saw strong upside momentum at the start of the week, and it was able to catch a valid long signal then.
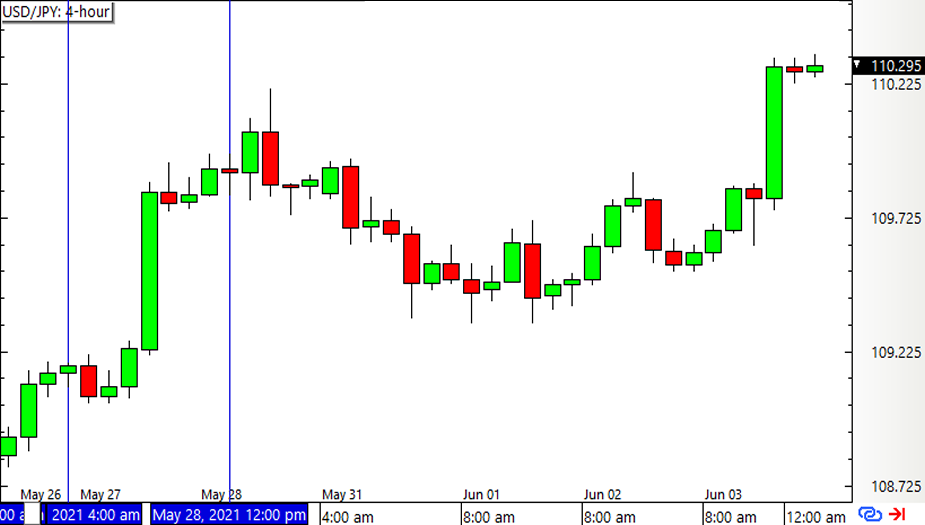
As a result, the first long position got stopped out quickly before the sharp rally took place. Bah!
Another valid long signal came up towards the end of the rally, and this managed to hit the target.
Now here’s what went on with GBP/JPY:
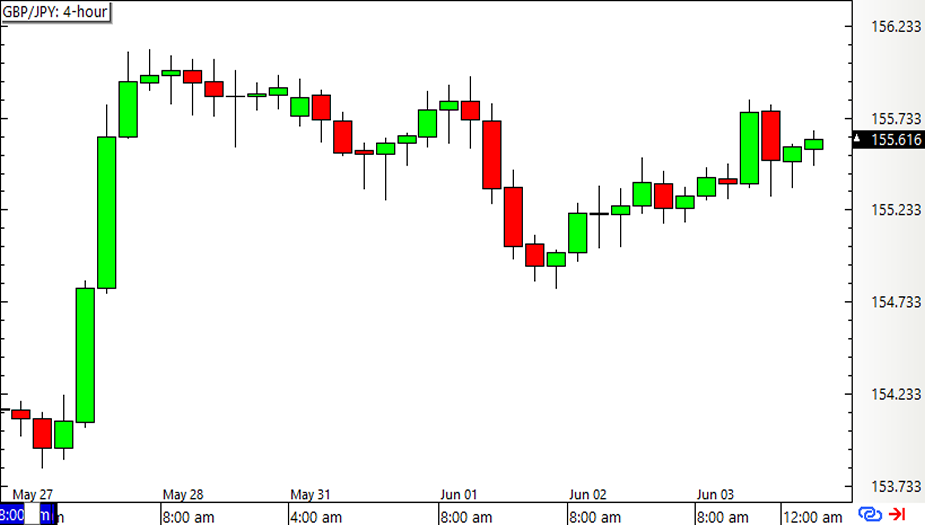
This pair also had a very strong rally early in the week.
But unlike USD/JPY, it wasn’t able to bank on this big move at all!
As you can see from the chart above, GBP/JPY had a few inside bar formations, but none of these had their entries triggered.
With that, the Inside Bar Momentum Strategy ended up with a meager 5-pip gain for the week from USD/JPY’s trades.
The percentage win/loss depends on how position sizes are calculated.
ICYMI, see how the numbers added up for Q1 2021.