


NZD/USD got rejected from a previous resistance area and looks set to test lower inflection points!
How low can NZD/USD go before it extends its weeks-long uptrend?
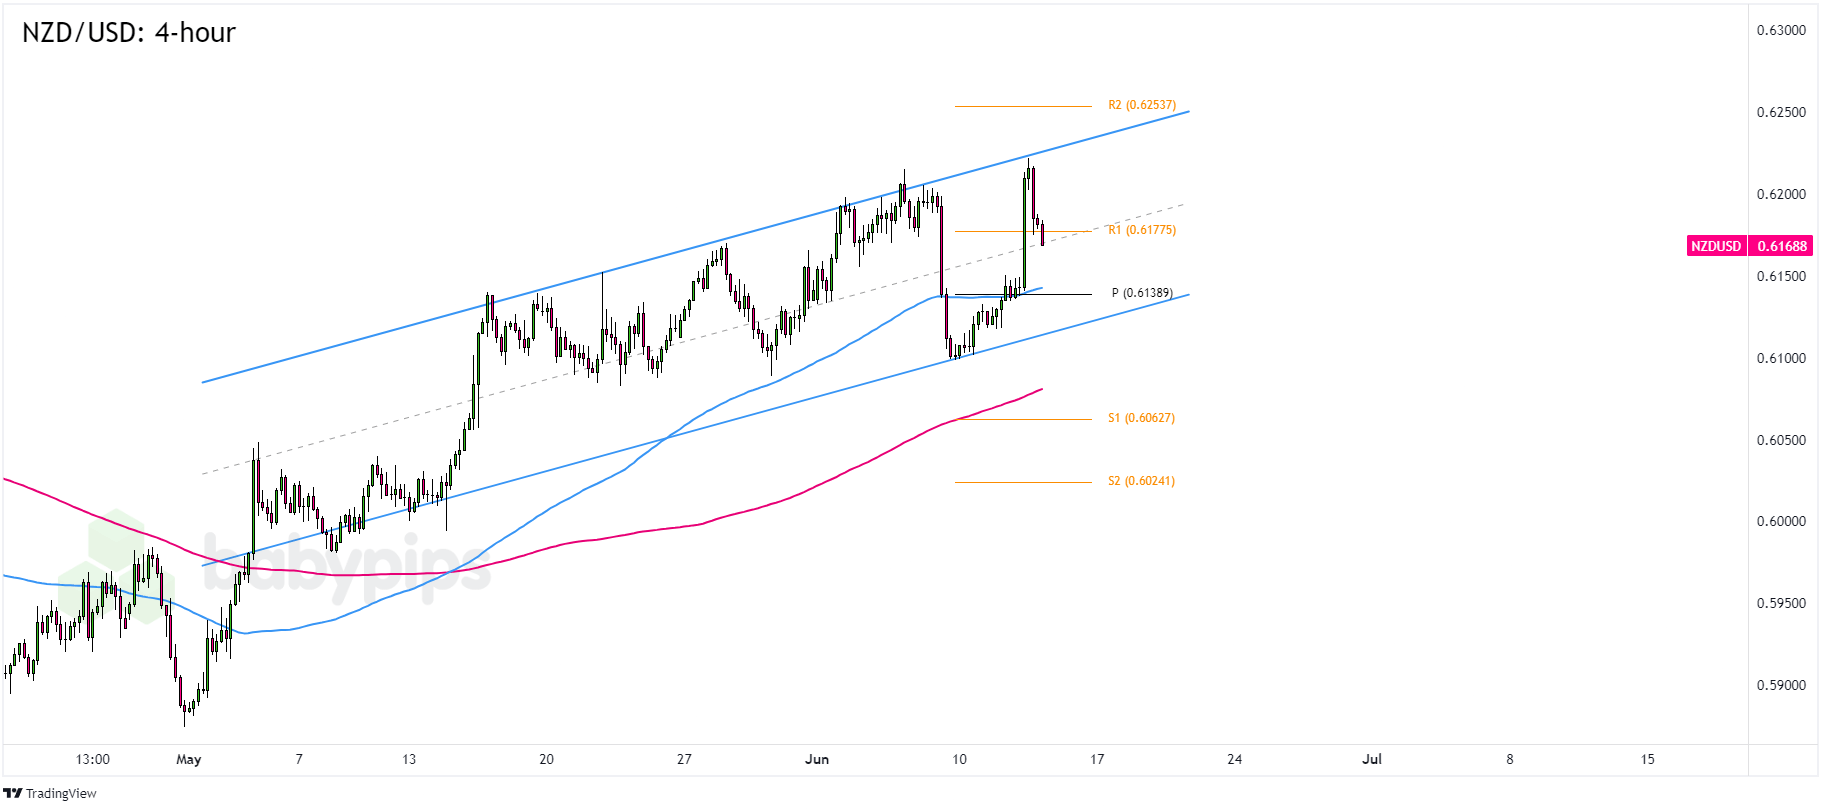
Let’s check out the 4-hour time frame:
NZD/USD: 4-hour
NZD/USD 4-hour Forex Chart by TradingView
NZD/USD has been making higher highs and higher lows since the start of May when the pair found support from the .5875 area of interest.
Then, weaker-than-expected U.S. CPI readings bumped the pair allll the way up to the .6220 levels yesterday. Unfortunately for the bulls, the Fed also pulled a “hawkish hold” event and the U.S. dollar regained some of its losses.
Remember that directional biases and volatility conditions in market price are typically driven by fundamentals. If you haven’t yet done your fundie homework on the U.S. and the New Zealand dollars, then it’s time to check out the economic calendar and stay updated on daily fundamental news!NZD/USD is now trading closer to the .6165 area near the R1 (.6178) Pivot Point line and a mid-channel support in the 4-hour time frame.
Think Kiwi will see more losses against the Greenback before the bulls step in? Look out for bullish candlesticks from the current levels. A move to the .6140 Pivot Point line and 100 SMA area is also on the table if NZD/USD gains bearish momentum after its rejection at .6220.
We may even see a retest of the .6100 psychological handle if NZD/USD bears aim for the bottom of the ascending channel pattern!
But if the U.S. dollar continues to see bullish demand, or if market risk sentiment leans against risk-taking, then NZD/USD may extend its downswing below the channel pattern. The pair may head to the 200 SMA and the S1 or S2 Pivot Point areas before seeing sustained bullish pressure.
Good luck and good trading this one!