


I’ve got this pair’s head and shoulders pattern on my radar since a break below the neckline could spur a long-term decline.
How low can AUD/USD go?
Short AUD/USD Trade Idea
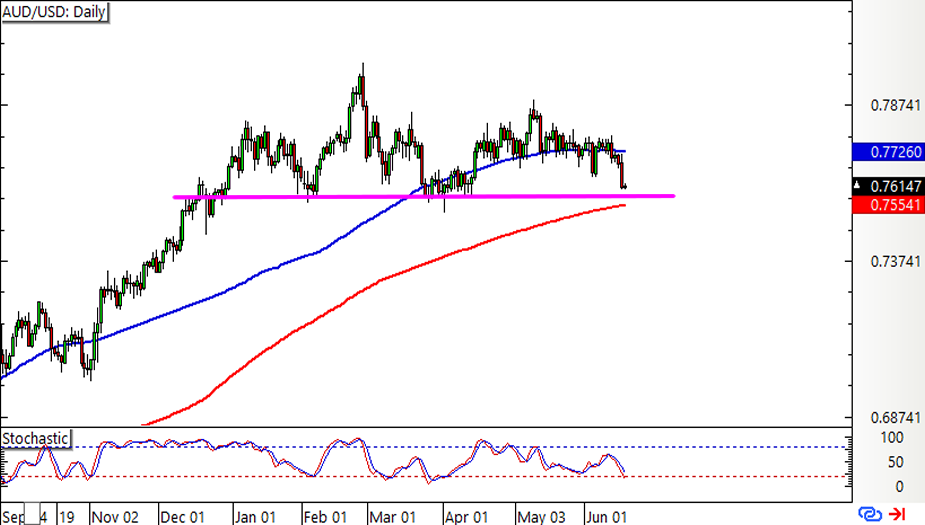
AUD/USD is closing in on the neckline support around the .7550-.7600 area, and a break below this could confirm that a downtrend is due.
The chart pattern spans around 400 pips in height, so the resulting drop could be of the same size.
Technical indicators are giving mixed signals. Stochastic is heading south to reflect the presence of selling pressure, but the 100 SMA is above the 200 SMA to suggest that the uptrend might still resume.Fundamentals, however, might favor more gains for the U.S. dollar since the FOMC hinted that interest rate hikes could happen sooner than initially expected.
As it turns out, the dot plot forecast suggests a strong likelihood of two hikes in 2023, with some policymakers even projecting an increase in borrowing costs for this year.
Because of that, the Greenback surged against its peers after the announcement and might still have some bullish energy left for another leg higher.I’m hoping to enter on a break of the neckline support, but I’ll have to review the average AUD/USD volatility to figure out where to set my entries and exits.

Based on this table, the pair moves roughly 60 pips per day, so I’m thinking of setting a stop loss that’s twice that size to give it enough leeway for a couple of days.
As for the target, I’ll aim for the 400-pip height of the chart pattern, but I’ll likely be trailing my stop along the way.
What do you guys think?
This content is strictly for informational purposes only and does not constitute as investment advice. Trading any financial market involves risk. Please read our Risk Disclosure to make sure you understand the risks involved.