


Big beatdown for the crypto assets over the past few, and especially in the past few days. Some assets have dropped to levels where we saw previous buying support, so the question is now whether or not the bulls will take back control?
Polkadot (DOT) and Chainlink (LINK) fit that picture, and could be solid opportunities for longer-term technical plays on blue chip crypto assets. Let’s check’em out!
DOT/USD Daily
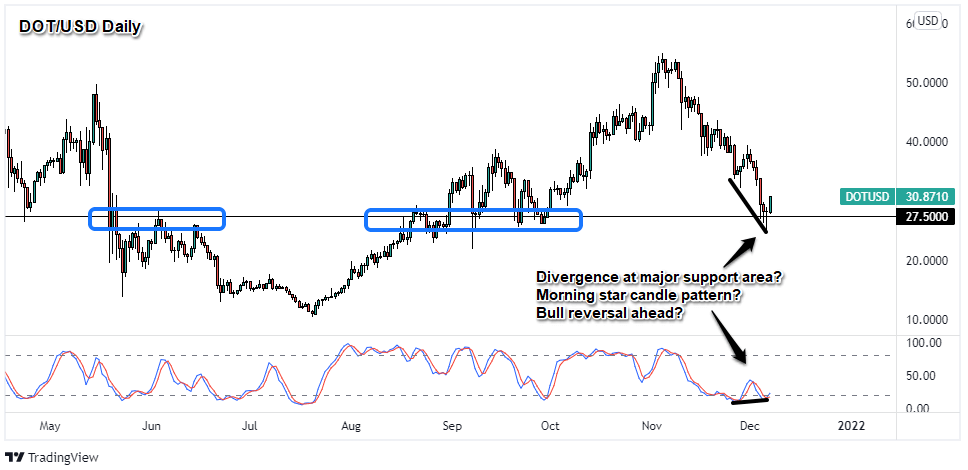
First on deck is Polkadot (DOT), a top 10 crypto asset by market cap ($30B) and the governance token for the Polkadot.network. DOT/USD saw a massive runup from July to November, getting a little extra bullish kick as it began opening up its Parachain features, touching the $55 handle in the process.
Since then, it’s been a downwards slope back to August/September levels around 27.50, largely on the broad crypto pullback likely driven by broad risk-off sentiment over the past few weeks (thanks to emergence of Omicron variant and possible economic issues with high global inflation rates).
So, there wasn’t any fundamental catalysts related to Polkadot for the big dip from $55 to $27, making this major support area retest a potential candidate for buyers looking to gain some exposure to an asset looking to solve the need for different blockchains to interconnect.
From a charting standpoint, this area looks like it could draw in technical buyers as we see bullish divergence between price and stochastic at a major support area. We’ve also got a morning star candlestick pattern forming, which tends to be a bullish signal for technical traders as well.
Keep an eye on this area and if broad risk sentiment does flip back to positive as Omicron fears fade, then we could see both a short-term and longer-term move back to the upside.
LINK/USD Daily
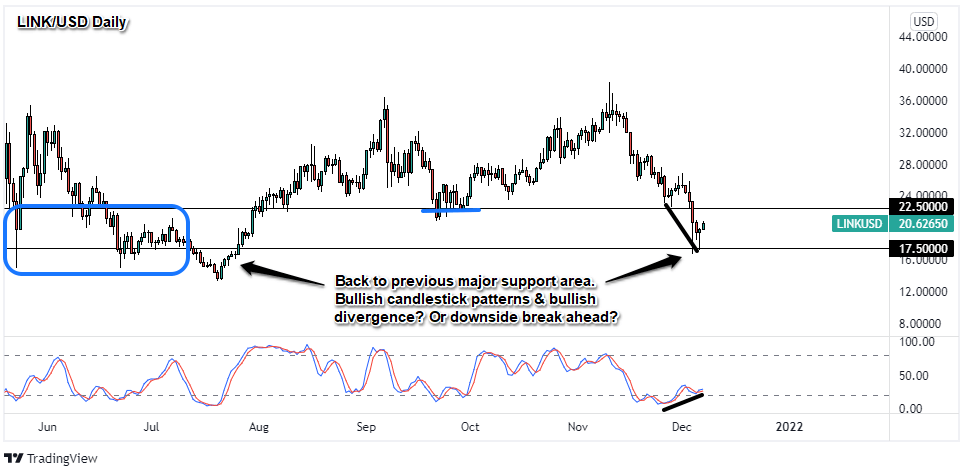
Chainlink (LINK) is also likely crypto asset of interest for technical traders as LINK/USD is back to the May 2021 crash lows that bottomed out and reverse in July. For those who don’t know Chainlink is a top 25 crypto asset that provides decentralized data services to various blockchains and smart contracts–an obvious utility in the blockchain world that will likely never go away.
So, the longer-term bull case is pretty strong that there will be a demand for the utility token of the network (LINK), and with LINK/USD now hitting a major support area (as well as bullish candlestick patterns), it’s definitely one to watch for bullish patterns before considering a long position.
Right now, we can see bullish divergence too around the $17 major support area, which is a strong technical setup for the bulls. Also consider that if limiting your risk to just below that support area and targeting your profit exit around previous swing highs, highly favorable reward-to-risk opportunities can be created.
Of course, if the broad market swings negative on recent inflation, pandemic concerns, or a black swan event that may be brewing that nobody sees, then a break below that $17 handle should be the price pattern to watch out for before considering a short position.
What do you all think? Is DOT a buy? Is LINK a buy? Will we see the crypto market dip further or is this the short-term bottom? Let me know in the comments section below!
This content is strictly for informational purposes only and does not constitute as investment advice. Trading any financial market involves risk. Please read our Risk Disclosure to make sure you understand the risks involved.