


A longer-term technical setup hits the watchlist this week for our equity and CFD friends out there, this time on Apple (AAPL).
After a broad market defying run higher since October, is the pullback we’re seeing just a dip or the start of a bear market move?
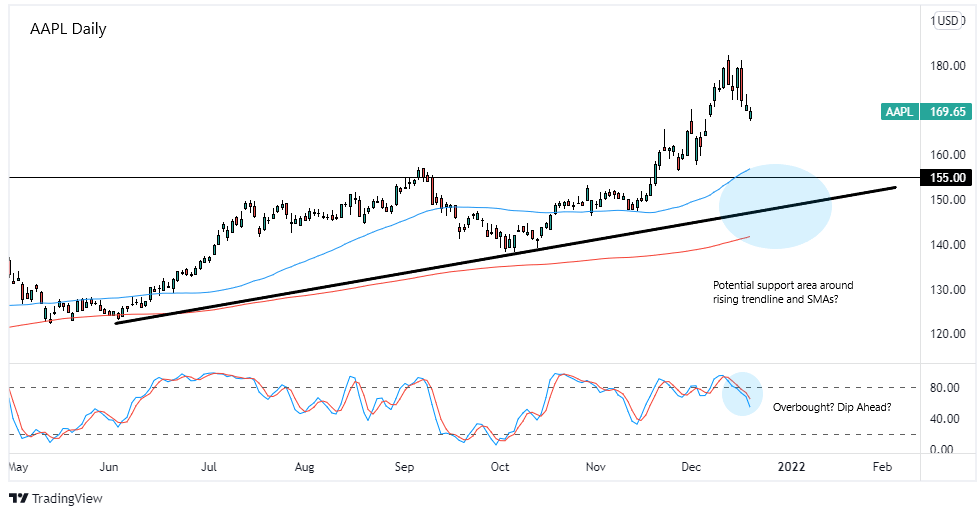
Potential Support Area If Apple (AAPL) Dips?
The last time we looked at Apple (AAPL) back in October, the stock was just starting to find buying support at the rising moving averages, around the $150 handle. It’s likely traders were starting to price in the fast approaching the fiscal year Q4 2021 earnings report from the company, apparently expecting not only the usual strong financial numbers, but also positive comments on supply chain issues and consumer demand.
As expected, Apple delivered a record $83.4B in revenue in the September quarter (up +29% y/y but slightly below expectations), all despite supply chain constraints that likely cost the company $6B in revenue. Product and services gross margins also improved over the Q4 2020 numbers, basically showing that Apple continues to be a money making machine and likely to continue to attract capital going forward from the earnings report.
And it looks like that was the case as the stock price rose in November, which was an interesting move as the broad market started to dip around that time as Omicron variant fears started to take broad risk sentiment negative. Since those headlines hit around November 24, AAPL actually rallied as high as $181.00 (+10%) while the Nasdaq 100 traded almost completely in the red since.
Apple seems to finally be giving back its gains in December as broad risk sentiment continues to worsen on pandemic fears and central bank monetary policy tightening fears, now trading just below the $170 handle at the moment. The question now is how far could it dip and will the bulls jump back in?
Given its relative strength during a net negative risk sentiment period, any kind of dip would likely draw in not only longer-term fundamental bulls, especially if broad risk sentiment improves. Short-term fundamental bulls may also hop on a dip as we fast approach the next earnings call in January, where we could see another round of record revenue numbers.
Technical traders would also likely be eyeing long positions as well given the longer-term price uptrend. The area to watch on a dip is the potential support area around the rising moving averages and trendline marked on the daily chart above, roughly in the $145 – $155 range.
Bullish candlestick patterns there and oversold signals from stochastic raise the odds that traders could hop in if the broad market environment leans more positive and Apple’s positive fundamental story remains intact. Of course, if broad market sentiment worsens, then traders may not be took keen on putting risk back on, even in top tier companies like Apple.
What do you think? Is Apple a longer-term buy? Or will negative risk sentiment vibes continue into 2022 and take AAPL down with it?
Let me know in the comments below, and as always, remember to never risk more than 1% of a trading account on any single trade. Adjust position sizes accordingly. Create your own ideas and don’t simply follow what I do.
This content is strictly for informational purposes only and does not constitute as investment advice. Trading any financial market involves risk. Please read our Risk Disclosure to make sure you understand the risks involved.