


Is this pair in for a reversal from its climb?
Here are the inflection points I’m watching on NZD/USD.
NZD/USD Trade Idea
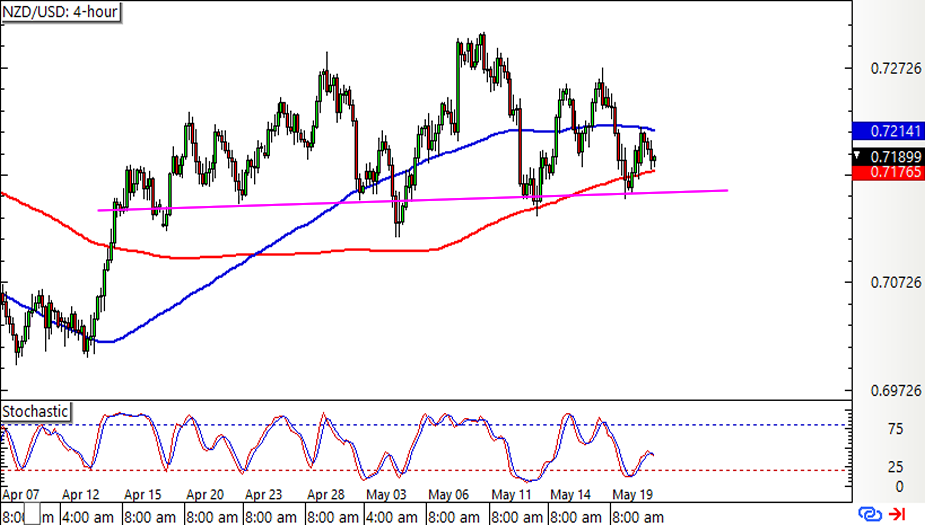
A head and shoulders pattern has formed on the pair’s 4-hour chart, and it looks like price is attempting to break below the neckline.
Are sellers about to take over from here?
Technical indicators are suggesting otherwise, as the 100 SMA is above the 200 SMA while Stochastic is heading higher.However, it’s worth noting that the gap between the moving averages is narrowing to reflect slowing bullish momentum. In addition, NZD/USD is trading below the 100 SMA dynamic inflection point, so this could hold as a ceiling.
The pair has yet to fall below the neckline at the .7150 minor psychological mark to confirm that a selloff is due. If that happens, NZD/USD could tumble by the same height as the chart formation or around 150 pips.
Aside from the U.S. flash PMI reports due later today, any shifts in market sentiment could also bring some big moves for this pair. In terms of fundamentals, the Fed’s taper hints revealed in the FOMC minutes might also tilt the odds in favor of the Greenback.
This content is strictly for informational purposes only and does not constitute as investment advice. Trading any financial market involves risk. Please read our Risk Disclosure to make sure you understand the risks involved.