


I’ve been watching this NZD/JPY rising channel for a while now, so you can imagine how excited I am to see this bullish divergence!
NZD/JPY Trade Idea
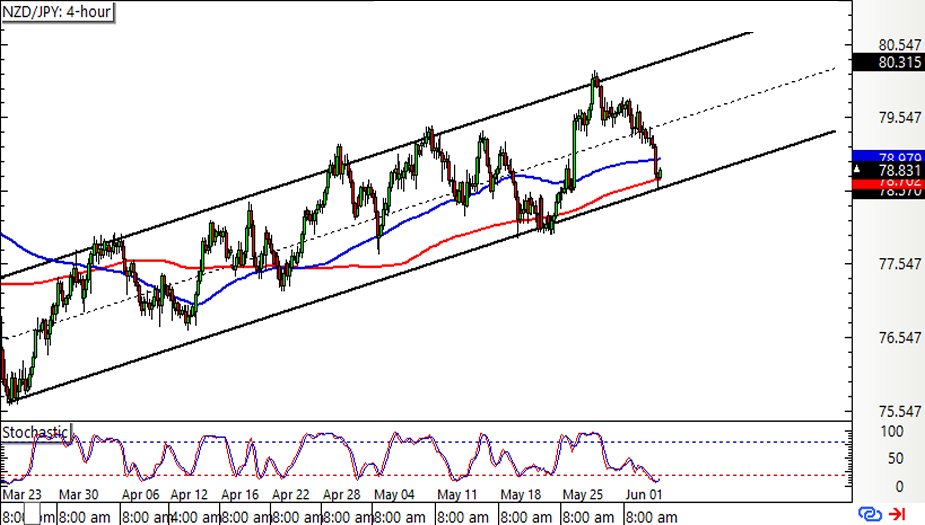
The pair is sitting right on the channel bottom, which appears to be holding as support so far.
Will buyers step up their game right here?
The 100 SMA is above the 200 SMA to confirm that the uptrend is more likely to resume than to reverse. To top it off, the 200 SMA is right smack in line with the channel support to add to its strength as a floor.Even better, Stochastic is reflecting exhaustion among sellers and is showing a bullish divergence to boot!
See how the oscillator made lower lows while price had higher lows?
There are no major catalysts from both New Zealand and Japan for the rest of the week, so the main driving factor could be market mood swings.In particular, a pickup in risk appetite could be enough to lift the higher-yielding Kiwi while weighing on the safe-haven yen.
I’m considering hopping in at market, and I’m checking the average NZD/JPY volatility as a guide for my stop loss and profit target placement.

The pair’s usual pip movement per day seems to be enough leeway to set a stop below the channel bottom and the next minor psychological level at 72.50.
As for my PT, I’m setting my sights on the mid-channel area of interest at 79.75 then at the channel resistance near the 81.00 handle. What do you guys think?
This content is strictly for informational purposes only and does not constitute as investment advice. Trading any financial market involves risk. Please read our Risk Disclosure to make sure you understand the risks involved.