


Where to next, bitcoin?
BTC/USD recently fell through its short-term support zone and is now in the middle of a correction to this very same area.
Will it hold as resistance this time?
Bitcoin (BTC/USD): 4-hour
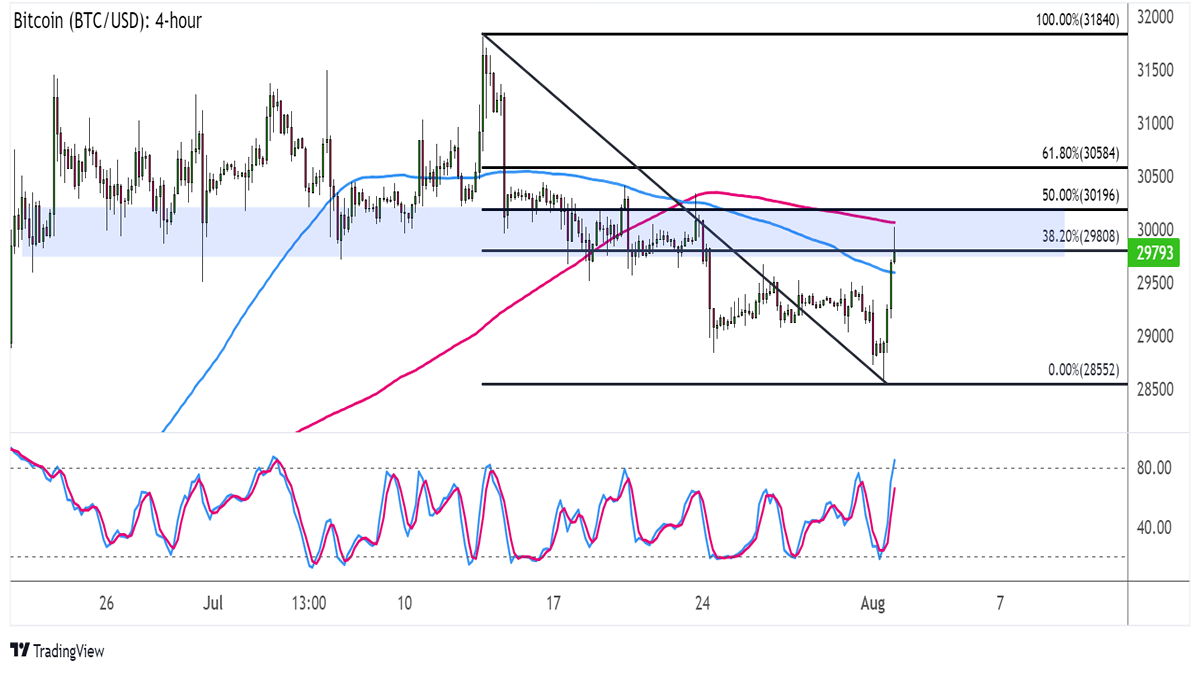
Bitcoin (BTC/USD) 4-hour Chart by TV
Bitcoin has been on a dive over the past couple of weeks, but it seems to be pulling up for air early this month.
Is this merely a correction from the slide, though?
The Fibonacci retracement tool reveals that the former support area around the $30,000 major psychological mark is spanned by the 38.2% to 50% levels.A higher correction could still reach the 61.8% Fib level at $30,600 but this might be the line in the sand for a bearish correction, as a break higher could signal that bitcoin bulls are charging again.
If any of the Fibs are able to keep gains in check, BTC/USD could fall back to its recent lows around $28,550 or lower. Technical indicators appear to be leaning towards a continuation of the selloff, too.
The 100 SMA is below the 200 SMA to signal the presence of bearish vibes while also serving as potential dynamic resistance levels at the area of interest.
Stochastic has a bit more room to climb before reflecting exhaustion among buyers, so the correction could keep going until the oscillator reaches the overbought zone. Turning lower would confirm that bearish momentum is returning.
Better keep close tabs on crypto-related headlines and changes in overall market sentiment to gauge where bitcoin might be headed next!
This content is strictly for informational purposes only and does not constitute as investment advice. Trading any financial market involves risk. Please read our Risk Disclosure to make sure you understand the risks involved.