


Trend warriors gather ’round!
Bitcoin (BTC/USD) has seen enough demand to push it to a potential resistance area.
Will the OG crypto extend its losses this week?
BTC/USD: 4-hour
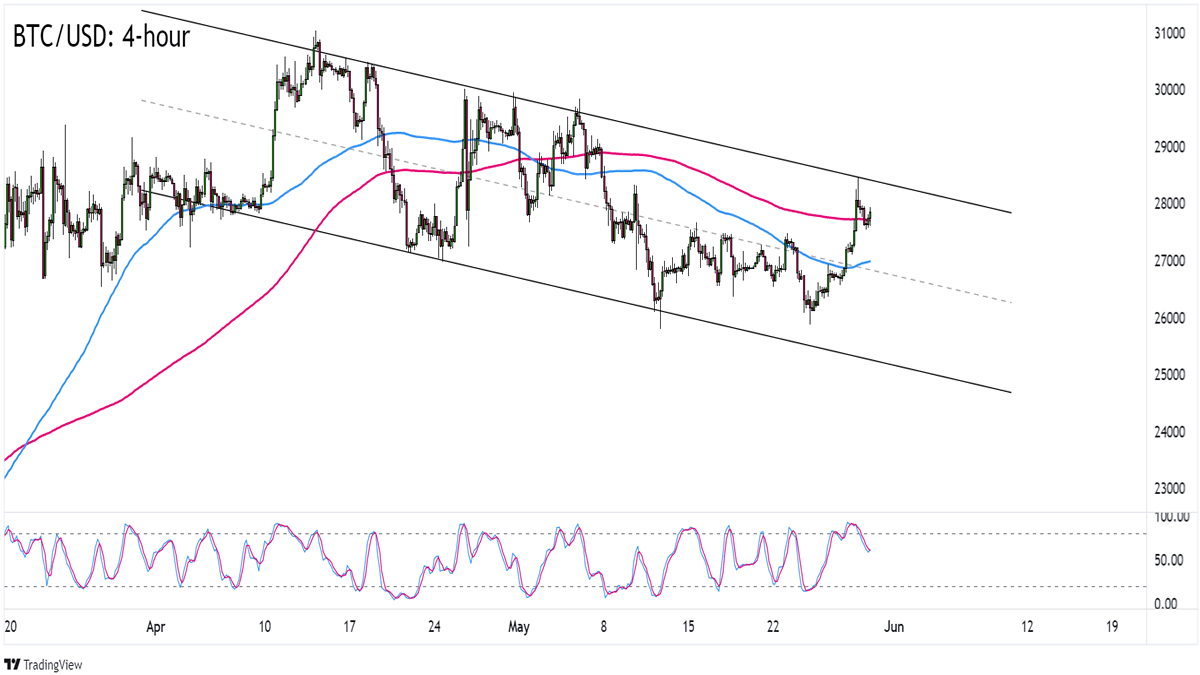
Bitcoin (BTC/USD) 4-hour Chart Chart by TV
Over the past few days, bitcoin (BTC/USD) has seen enough demand to push the pair back to the $28,400 zone.
But the bearish force was too strong around the area and now BTC/USD is trading just under the $28,000 mark.
Will the rejection at $28,400 lead to further losses for BTC?Trend traders who are confident that BTC/USD will remain inside a descending channel can short at current levels and target May’s lows under $26,000.
Not convinced that BTC/USD can extend its downtrend?
Look out for a clear break above the trend line that we marked.
The moving averages can also offer clues.
The 100 SMA is staying below the slower 200 SMA for now but watch out for signs of the moving averages pointing and maybe crossing higher for signs of a sustained uptrend.
If BTC/USD breaks above the channel, then you eye the $29,000 and $30,000 areas of interest as possible targets.
What do you think? Can BTC/USD maintain its downtrend?