


Who’s up to trade reversals?
If you’re on the lookout for major trend changes, then these double bottom patterns on NZD/JPY and GBP/CAD could be worth keeping tabs on.
GBP/CAD: 4-Hour
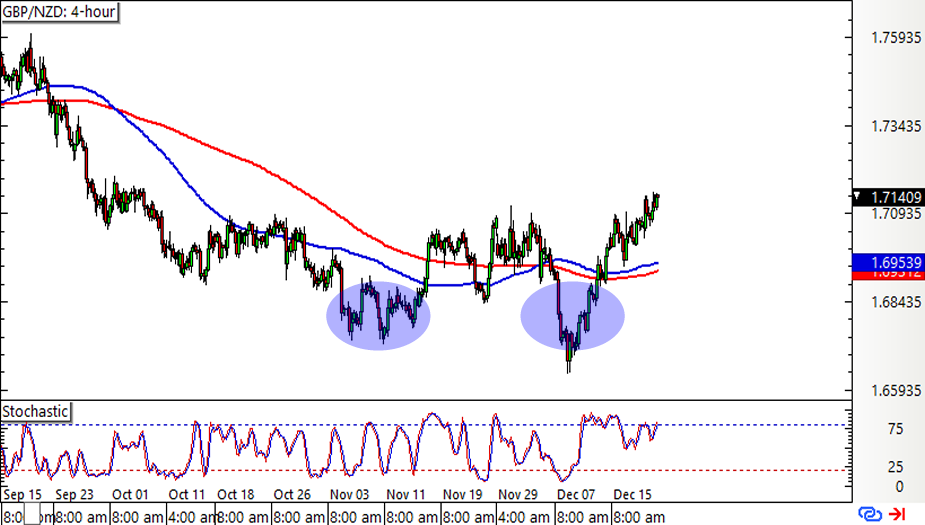
This pair gave up on its last couple of attempts to break below the 1.6700-1.6800 zone, creating a double bottom pattern on its 4-hour chart.
Price already seems to have broken above the neckline to confirm that a reversal from the downtrend is underway. If so, brace yourselves for a rally that’s the same height as the chart formation, which spans roughly 400 pips.The recent bullish moving average crossover confirms that buyers regained the upper hand, possibly giving them enough energy to take GBP/NZD up to the 1.7500 area next.
Stochastic is also heading north, so price could follow suit, but the oscillator is closing in on the overbought zone to signal exhaustion.
NZD/JPY: 4-hour
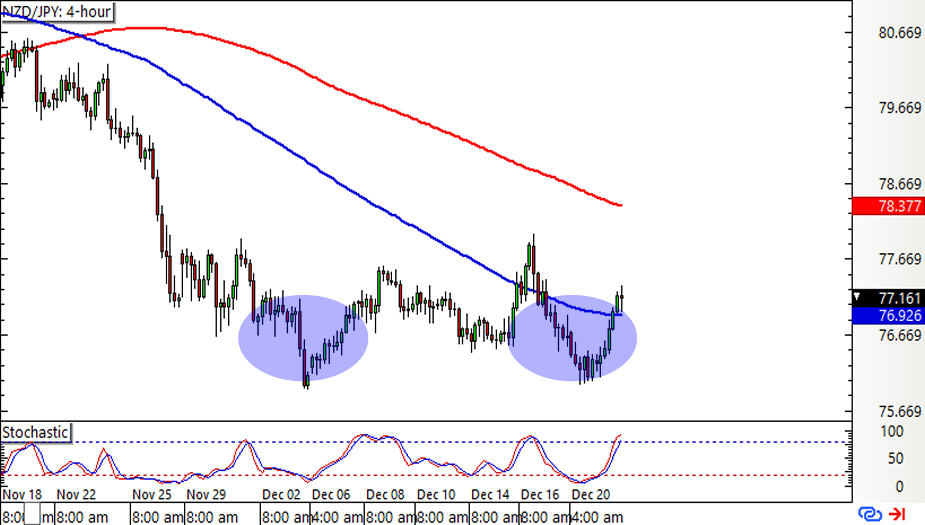
If you’re Kiwi bearish, be careful!
NZD/JPY is struggling to close below the 76.00 handle and looks ready to test the neckline resistance at 77.75. A break higher could set off an uptrend that’s the same height as the double bottom reversal pattern.However, the 100 SMA is still below the 200 SMA to indicate that the path of least resistance is to the downside. In other words, resistance is more likely to hold than to break, possibly sending the pair back down to the lows.
At the same time, Stochastic is approaching the overbought region to reflect exhaustion among buyers. Turning lower would confirm that sellers are back in the game.
Better keep your eyes peeled for either reversal or breakout candlesticks at the next area of interest!