


Not a fan of consolidations?
Bruh, that just means traders are having trouble deciding on the next direction.
BTC/USD and GBP/NZD are testing the resistance levels of their triangles so we just might see volatile price action!
BTC/USD: 4-Hour
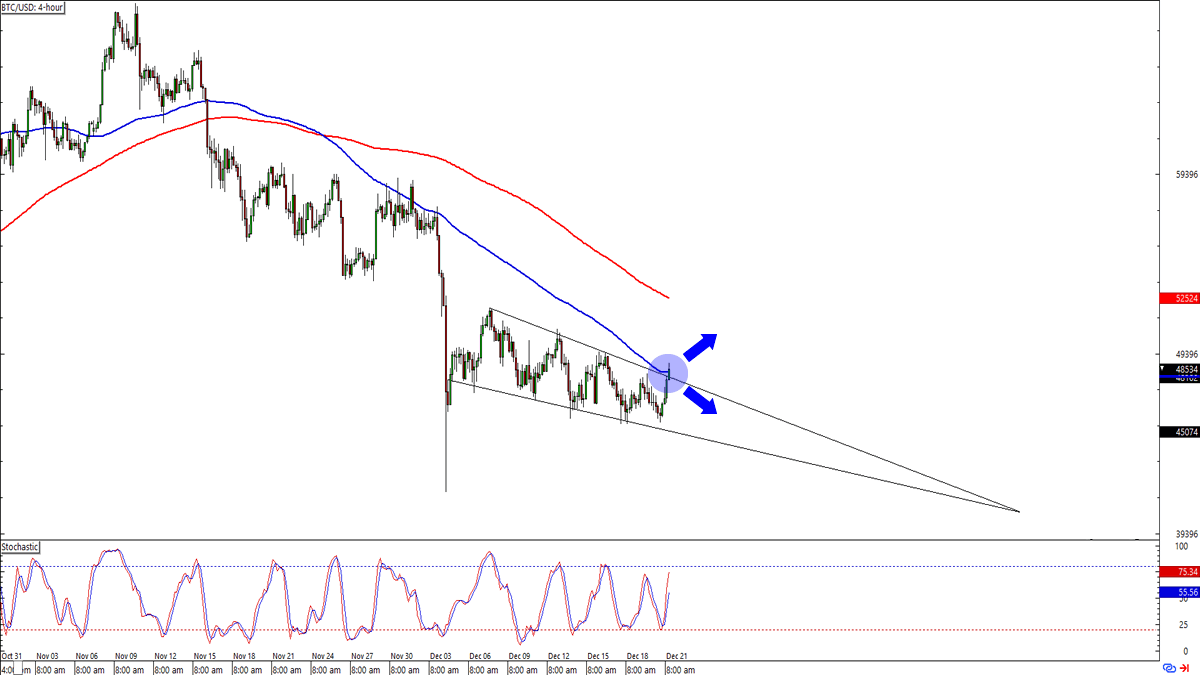
Bitcoin is trading in what looks like a falling wedge pattern after falling from $68,500 to the $46,000 starting early November.
What makes the chart interesting today is that BTC/USD looks ready to bust above the wedge AND the 4-hour chart’s 100 SMA.Think we’ll see an upside breakout in the next trading sessions?
Buying at current levels would mean a good entry spot in case we are seeing a breakout in the making. The 200 SMA is a good initial target but you can also aim for the $59,000 resistance if there’s enough momentum.
If BTC/USD fails to sustain an upside breakout, though, then you gotta be ready for BTC/USD to stay inside the wedge. You can target the $46,000 support or even new lows depending on the strength of the sellers’ momentum.
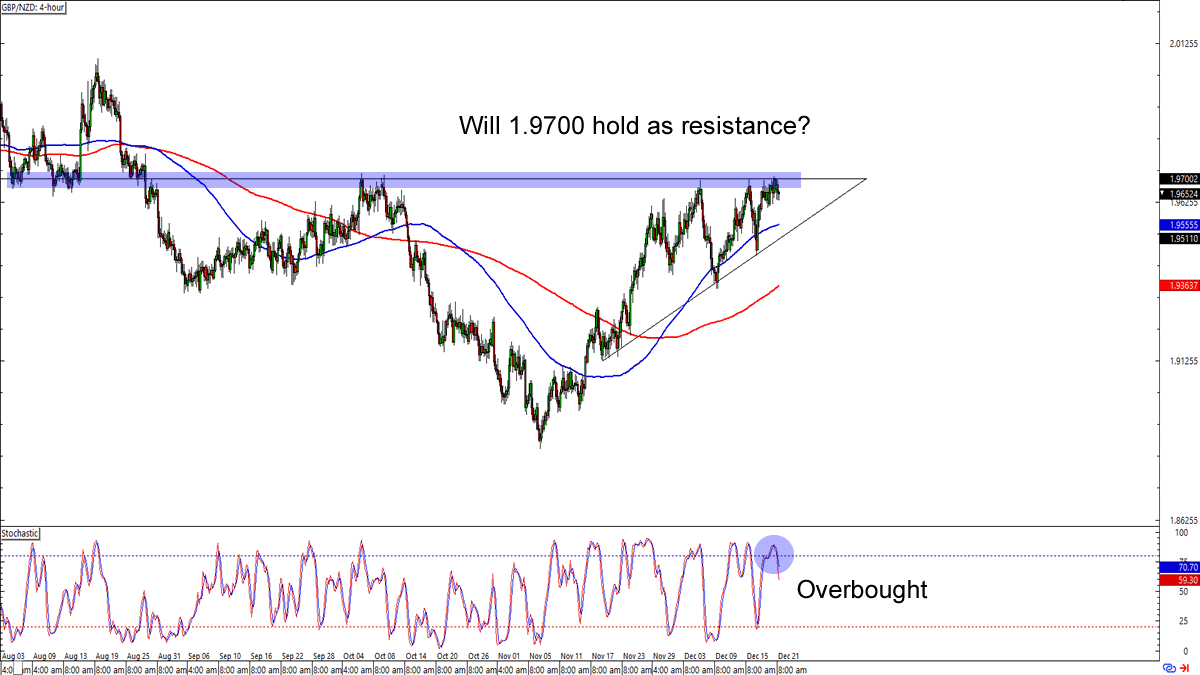
GBP/NZD: 4-hour
Pound bears gather ’round!
GBP is knocking at the 1.9700 psychological handle, which is a MAJOR area of interest on GBP/NZD’s short and long-term charts.Sellers who take cues from Stochastic‘s overbought signal can short at current levels and aim for the ascending triangle support near the 100 SMA.
If you’d rather bet on GBP/NZD successfully breaking above the triangle, though, then you can eye areas of interest like 1.9950 or the big 2.0000.
AFTER you confirm a breakout, of course.