


Whattup, forex buddies!
We’ve got two opportunities to trade comdoll retracements today because AUD/CAD and EUR/NZD are poppin’ up REALLY similar setups.
Get ’em while they’re hot!
EUR/NZD: Daily
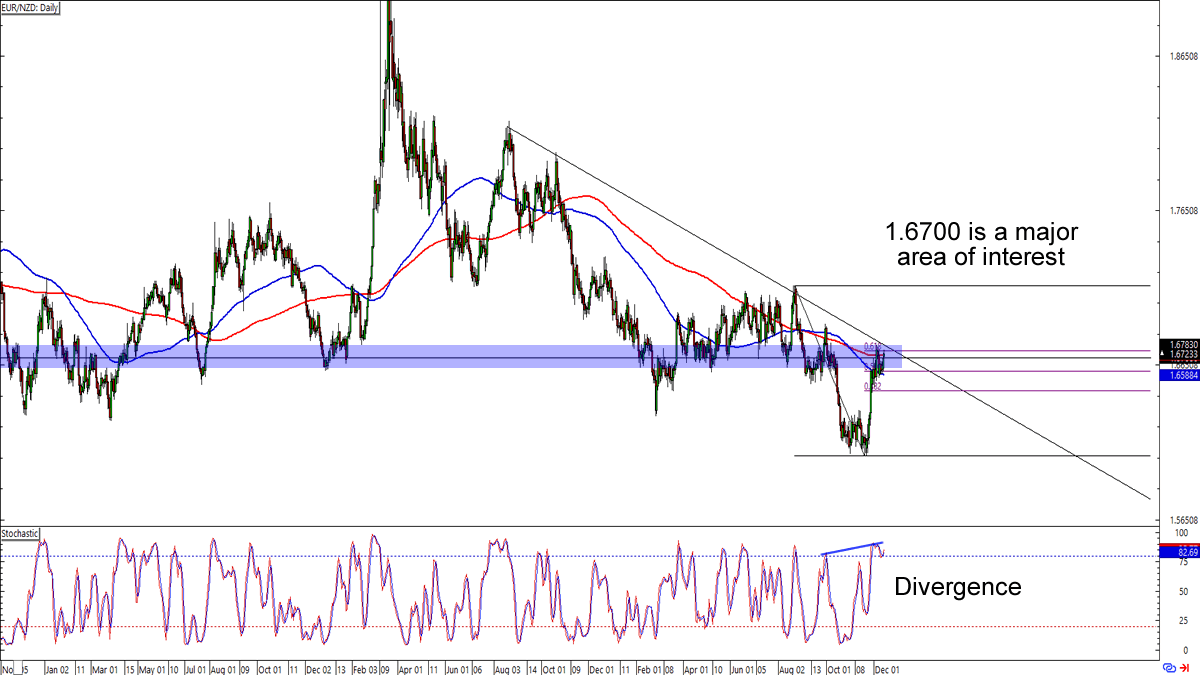
Inflection point alert! EUR/NZD is hanging out at the 1.6700 zone that lines up with a trend line resistance that’s been around since August.
But wait, there’s more! As you can see, the current levels are also near a MAJOR area of interest on the daily time frame. It’s also where the 50% Fib pullback and the SMAs are at!Euro bears who plan on trading the bearish divergence can short at current levels and aim for November’s lows near 1.6100.
Not a fan of euro shorts? You can still make plays for buying euros but you’ll want to do it after EUR/NZD clearly breaks above the trend line resistance on the daily.
Watch this setup closely so you don’t miss out on a trend continuation or an upside breakout!
AUD/CAD: Daily
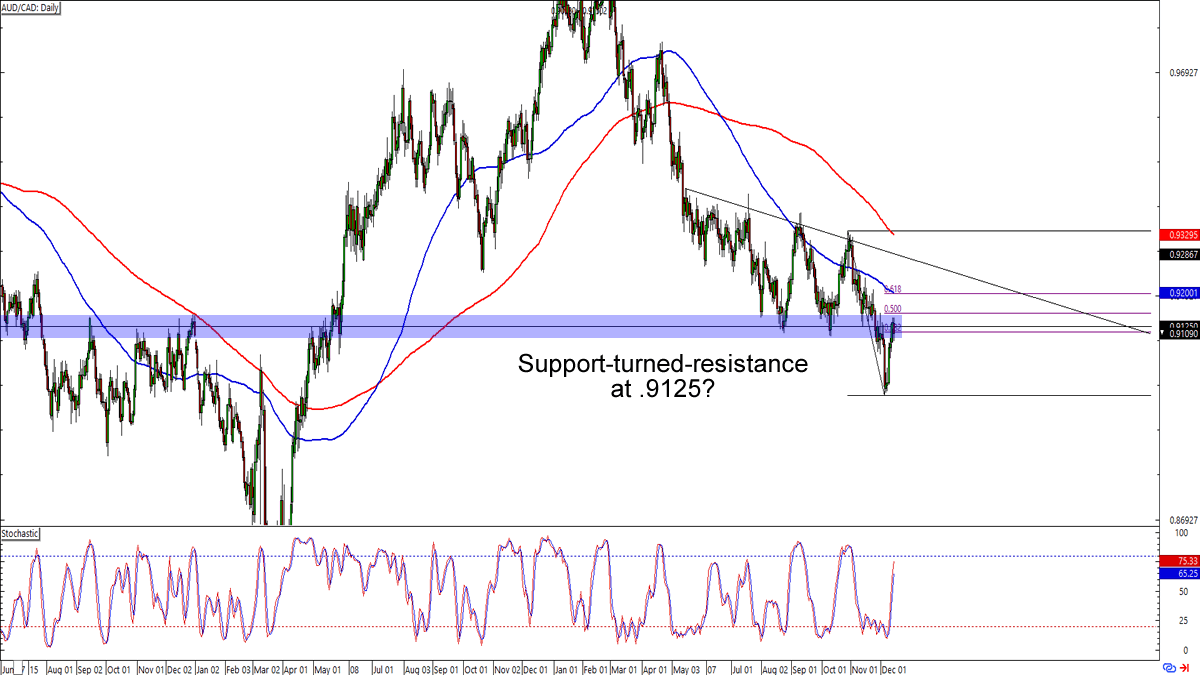
No, you’re not seeing double. AUD/CAD’s downswing is seeing a retracement to the 38.2% Fibonacci level, which conveniently lines up with an area of interest on the daily time frame.
Will the .9100 broken support turn into a resistance?
AUD/CAD is consolidating at the zone but that doesn’t mean that the bulls can’t push it to the .9200 MaPs near the 100 SMA or .9250 area closer to the trend line resistance.Aussie bears can short at current levels but the more conservative traders can sell as soon as there’s bearish momentum. The .9000 lows is a legit initial target but you can also design trading plans around new monthly lows as your targets.
Meanwhile, Aussie bulls would have to wait for bullish candlestick patterns or at least some momentum before buying AUD.
The trend line resistance is the first hurdle but a breakout beyond the 200 SMA would also increase the odds of a bullish momentum!