


Ready for a brand-spankin’ new week of forex trading?
Comdoll playas are in for a treat because we’re looking at not one but TWO opportunities to be friends with trends.
Check out what’s happening on NZD/USD and GBP/AUD’s charts!
NZD/USD: 4-hour
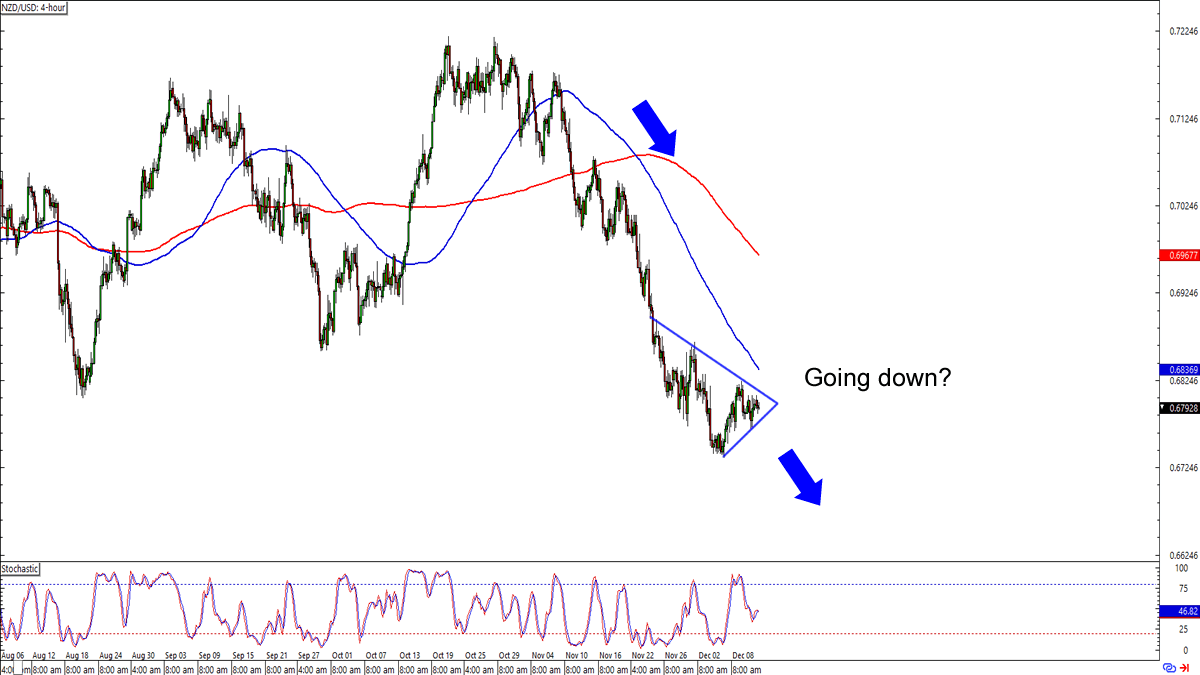
Kiwi bears are on a roll! NZD/USD has fallen by almost 500 pips since late October but now it looks like they’re taking a breather.
Are we looking at a bearish pennant pattern? A downside breakout could lead to a retest of the .6675 or even the .6625 previous areas of interest.Before you sell the Kiwi like there’s no tomorrow, though, you gotta remember that triangles are indecision patterns. That means Kiwi bulls still have a chance to make pips rain!
If NZD/USD breaks above the consolidation AND the 100 SMA on the 4-hour time frame, then the pair could have enough momentum to pop back up to .6900 or the .7000 inflection points.
GBP/AUD: Daily
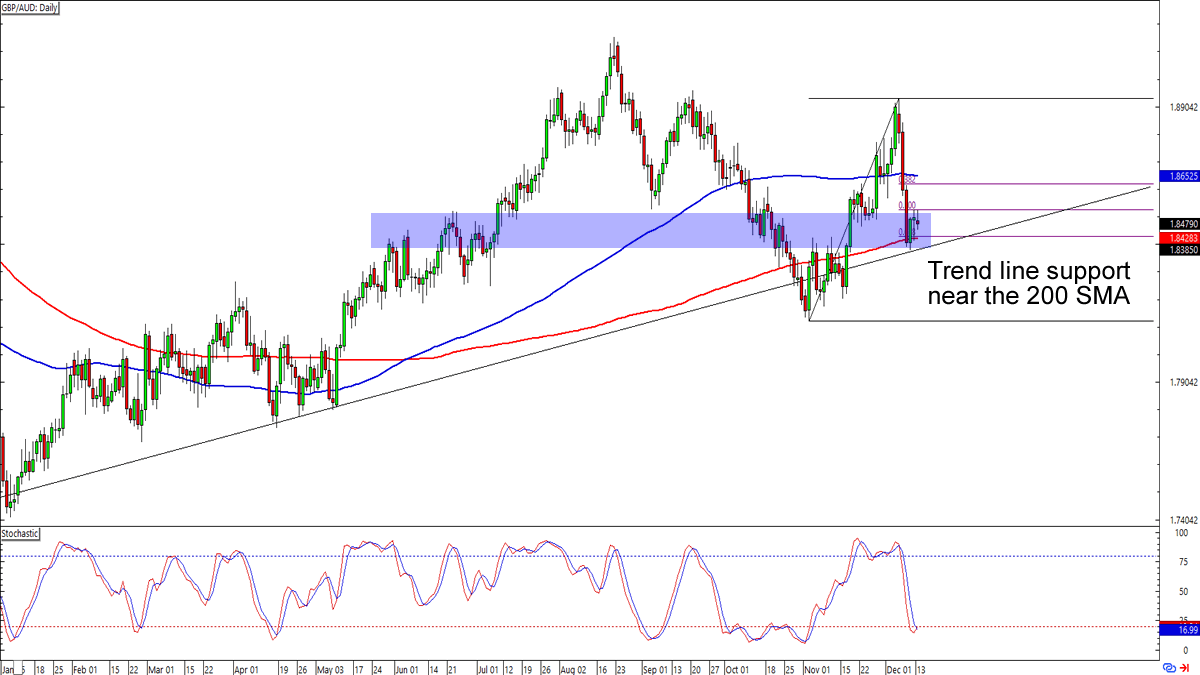
Here’s a pullback play for ya!
GBP/AUD dropped so sharply in the last coupla days that the pair is now trading near a trend line support that has been supporting the pound since the start of the year.
As you can see, GBP/AUD’s current levels also line up with the 61.8% Fibonacci retracement of November’s upswing as well as the 200 SMA on the daily time frame.Can the pound extend its gains against the Aussie? Buying at current levels is your best bet if you’re confident that GBP/AUD will extend its uptrend.
If you think that GBP/AUD is about to see a longer-term reversal, though, then you can also place orders just under the trend line and target areas of interest like 1.8150 or 1.7800 in case of a breakout.