


While the U.S. dollar was able to establish some direction for the most part of the day, price action was a hot mess for the rest of the asset classes.
Treasury yields were off to a rocky start before pulling steadily higher while bitcoin rallied then reversed. Crude oil also dipped midday but eventually made quite the rebound, and U.S. equity indices reached fresh record highs.
What went on?
Headlines:
- Australia employment change for April: 38.5K (22.4K expected, -5.9K previous)
- Australian unemployment rate for April: 4.1% (3.9% expected, previous reading revised from 3.8% to 3.9%)
- U.S. weekly initial jobless claims at 222K (219K expected, 232K previous)
- U.S. building permits for April: 1.44M (1.48M expected, previous reading upgraded from 1.46M to 1.49M)
- U.S. Philly Fed manufacturing index for May: 4.5 (7.7 expected, 15.5 previous)
- U.S. import prices for April: 0.9% m/m (0.2% expected, previous reading upgraded from 0.4% to 0.6%)
- U.S. industrial production for April: 0.0% (0.1% expected, previous reading downgraded to 0.1%)
- Three Fed officials (Mester, Williams and Barkin) signaled that inflation reaching their target may take longer than previously expected
- New Zealand PPI input prices for Q1: 0.7% q/q (0.6% expected, 0.9% previous), PPI output prices for Q1: 0.9% q/q (0.5% expected, 0.7% previous)
Broad Market Price Action:
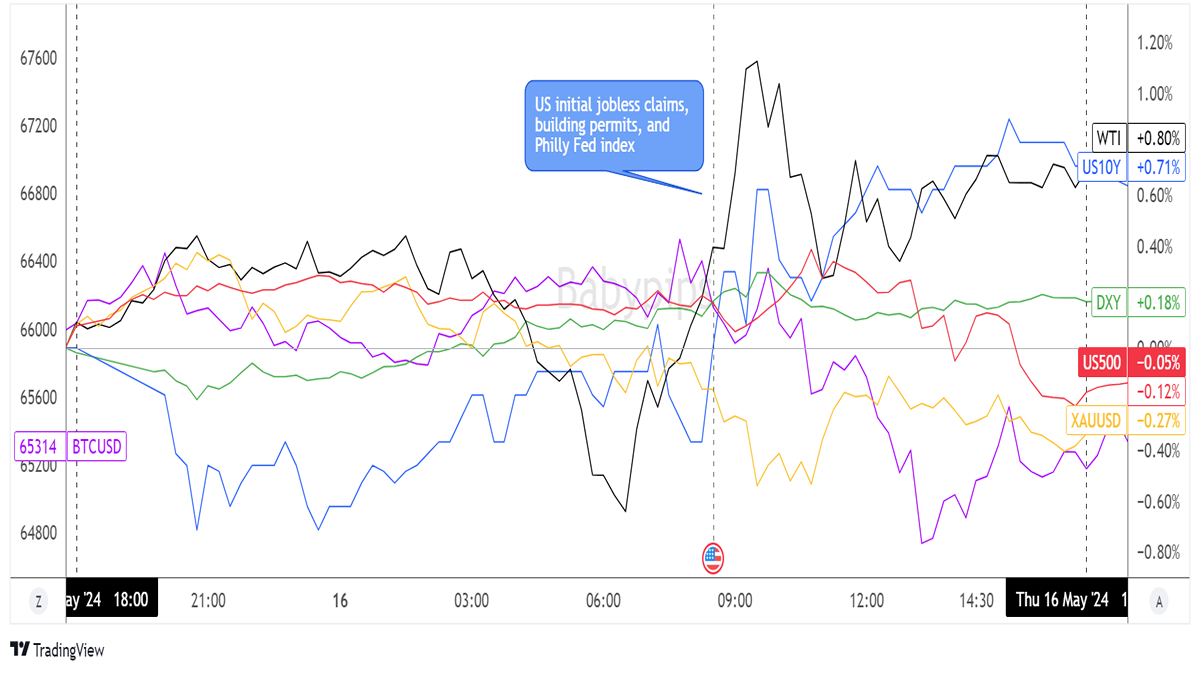
Dollar Index, Gold, S&P 500, Oil, U.S. 10-yr Yield, Bitcoin Overlay Chart by TradingView
Markets were off to a messy start from the get-go, as Treasury yields carried on with their descent from the previous trading session before bottoming out and finding its footing along with the dollar later in the day.
Crude oil tried to stay afloat during the Asian market hours but took a major hit when the IEA revised its oil demand outlook for the second month in a row. Meanwhile, gold was already struggling to hold its ground before it caved to dollar strength.
Despite mid-tier U.S. data coming in mostly below estimates, price action among risk assets still diverged. The DJIA tested the key 40,000 barrier for the first time while the S&P 500 index also retreated from record highs, as the frenzy over meme stocks like GME and AMC appeared to fade.
FX Market Behavior: U.S. Dollar vs. Majors
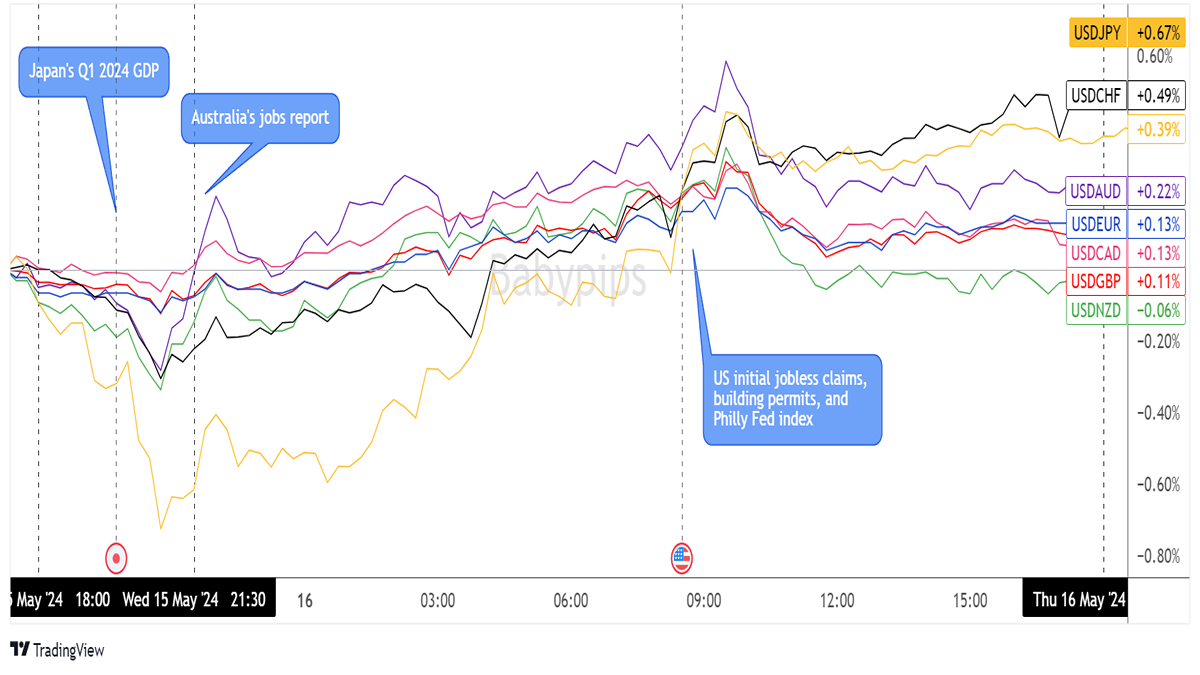
Overlay of USD vs. Major Currencies Chart by TradingView
The aftermath of the U.S. CPI release in the Asian session paved the way for a generally negative start for the dollar, particularly against the yen which enjoyed a boost from a relatively upbeat Q1 GDP and price index.
Additional volatility also came in play for AUD/USD, which reacted to Australia’s employment figures, as well as NZD/USD. From there, the U.S. currency staged a steady climb throughout the day, extending its gains despite mostly downbeat mid-tier data.
The weekly initial jobless claims, Philly Fed index, building permits and housing starts figures all came in below estimates, but some say that it might have been the uptick in April import prices and positive revision in March data that triggered USD strength.
In addition, hawkish commentary from three Fed officials who all suggested that interest rates might need to stay “higher for longer” to ensure inflation reaches the target might have also boosted the dollar.
Upcoming Potential Catalysts on the Economic Calendar:
- BOE MPC member Mann’s speech at 8:00 am GMT
- Eurozone final headline and core CPI at 9:00 am GMT
- U.S. CB leading index at 2:00 pm GMT
- FOMC member Waller’s speech at 2:15 pm GMT
- FOMC member Daly’s speech at 4:15 pm GMT
The schedule is looking light in terms of major economic releases, so the focus might still be on U.S. data and Fed rhetoric. Note that a couple more FOMC members are due to make speeches later today, which might mean additional USD volatility before the week comes to a close.
Looking for your own spot to record your market observations & trading statistics? If so, then check out TRADEZELLA! It’s an easy-to-use
journaling tool that can lead to valuable performance & strategy insights! You can easily add your thoughts, charts & track your psychology with each and every trade. Click here to see if it’s right for you!Disclaimer: Babypips.com earns a commission from any signups through our affiliate link. When you subscribe to a service using our affiliate links, this helps us to maintain and improve our content, a lot of which is free and accessible to everyone–including the School of Pipsology! We appreciate your support and hope that you find our content and services helpful. Thank you!