


The market spotlight was on the U.S. CPI release, which sparked a fresh set of volatile moves across asset classes.
Which ones ended in the green and in the red?
Somewhat weaker than expected U.S. inflation figures reinforced expectations of Fed easing for the year, along with downbeat headline retail sales data.
Headlines:
- Australia’s wage price index for Q1 2024: 0.8% q/q (0.9% expected, 1.0% previous)
- Chinese government reportedly considering buying millions of unsold homes to ease oversupply
- Eurozone flash employment change for Q1 2024: 0.3% q/q (0.3% expected, 0.3% previous)
- Eurozone flash GDP for Q1 2024: 0.3% q/q (0.3% expected, 0.3% previous)
- Eurozone industrial production for March: 0.6% m/m (0.5% expected, previous reading upgraded from 0.8% to 1.0%)
- Canadian manufacturing sales for March: -2.1% m/m (-2.4% expected, previous reading upgraded from 0.7% to 0.9%)
- U.S. headline CPI for April: 0.3% m/m (0.4% expected, 0.4% previous)
- U.S. headline CPI for April: 3.4% y/y (3.4% expected, 3.5% previous)
- U.S. core CPI for April: 0.3% m/m (0.3% expected, 0.4% previous)
- U.S. headline retail sales for April: 0.0% m/m (0.4% expected, previous reading downgraded from 0.7% to 0.6%)
- U.S. core retail sales for April: 0.2% m/m (0.2% expected, previous reading downgraded from 1.1% to 0.9%)
- U.S. Empire State manufacturing index for May: -15.6 (-9.9 expected, -14.3 previous)
- U.S. NAHB housing market index for May: 45 (51 expected, 51 previous)
- EIA crude oil inventories: -2.5 million barrels (-0.4M expected, -1.4M previous)
- Japanese preliminary GDP for Q1 2024: -0.5% q/q (-0.3% expected, previous reading upgraded from -0.1% to +0.1%)
- Japanese preliminary GDP price index for Q1 2024: 3.6% y/y (3.3% expected, previous reading upgraded from 3.8% to 3.9%)
Broad Market Price Action:
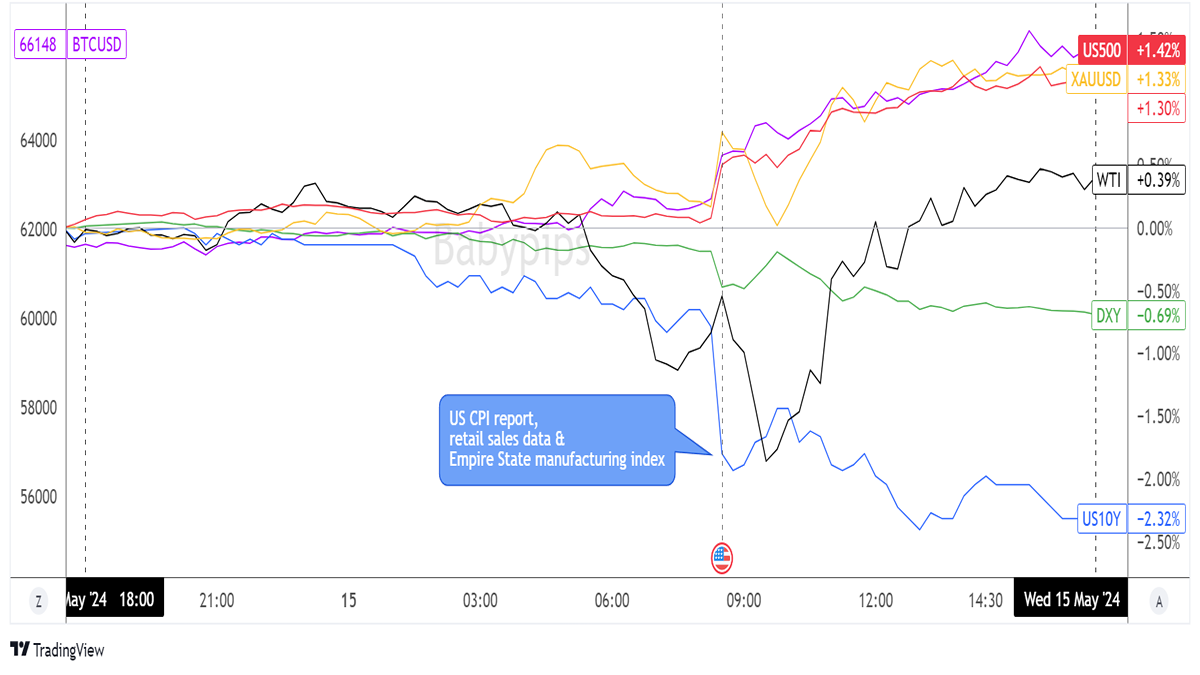
Dollar Index, Gold, S&P 500, Oil, U.S. 10-yr Yield, Bitcoin Overlay Chart by TradingView
Market participants appeared to be playing it safe ahead of the U.S. CPI release, as earlier trading sessions were mostly characterized by sideways price action across asset classes.
Still, Treasury yields were eager to start their descent, as investors were likely pricing in a subdued inflation report to follow the previous day’s “meh” PPI figures.
Crude oil was also noticeably in selloff mode during Asian market hours, despite a decline in private oil inventories as reported by the American Petroleum Institute. The commodity was able to stage quite the comeback later on, though, when the EIA inventory reported a similarly steep reduction in stockpiles that pointed to stronger demand conditions.
This rally was also likely buoyed by a pickup in risk appetite following the mostly downbeat U.S. CPI report, which revealed that headline consumer prices rose by a meager 0.3% month-over-month in April and that annual CPI fell from 3.5% to 3.4% as expected.
Gold, bitcoin, and the S&P 500 index cruised higher upon seeing the numbers while the dollar and U.S. bond yields moved south. It didn’t help the dollar’s cause that U.S. retail sales turned out mostly weaker than expected, as previous reports saw downgrades, while the Empire State manufacturing index chalked up a surprise decline.
FX Market Behavior: U.S. Dollar vs. Majors
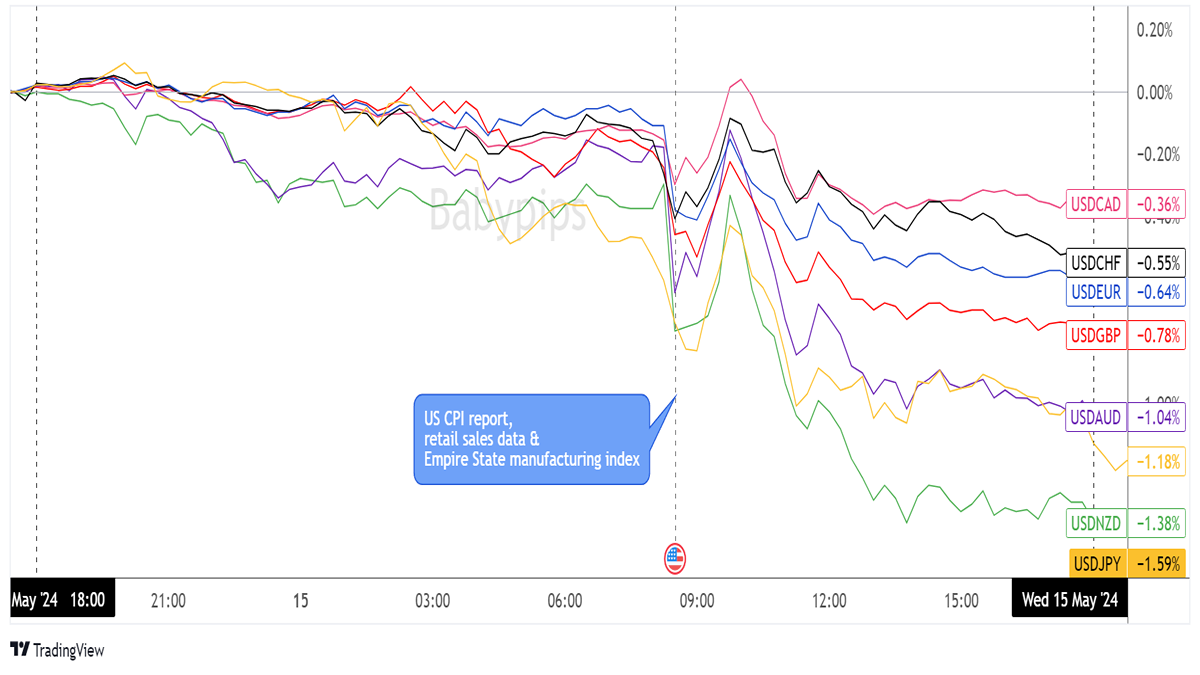
Overlay of USD vs. Major Currencies Chart by TradingView
Volatility was limited for most majors early in the day, as traders were likely enjoying the calm before the U.S. CPI storm.
Still, the Kiwi and Aussie were able to start off on strong footing, thanks to news that the Chinese government is considering buying millions of unsold homes in an effort to boost their troubled property sector.
Dollar traders appeared to be bracing for a disappointing CPI print, as there was a general bearish tilt for the U.S. currency leading up to the New York session. The actual inflation numbers sparked a dip for the Greenback when they failed to impress, especially since Uncle Sam also reported subdued retail sales and a surprise decline in the Empire State manufacturing index at the same time.
The initial bearish reaction was faded over the next couple of hours before the downward trajectory resumed for the rest of the trading day. The dollar chalked up its largest losses versus the Kiwi, yen, and Aussie while the Loonie lagged behind its forex peers.
Upcoming Potential Catalysts on the Economic Calendar:
- U.S. initial jobless claims at 12:30 pm GMT
- U.S. building permits and housing starts at 12:30 pm GMT
- U.S. Philly Fed manufacturing index at 12:30 pm GMT
- U.S. industrial production and capacity utilization at 1:15 pm GMT
- FOMC member Mester’s speech at 4:00 pm GMT
- FOMC member Bostic’s speech at 7:50 pm GMT
- New Zealand quarterly PPI at 10:45 pm GMT
The focus might still be on the U.S. dollar today, as the economy gears up to print a handful of mid-tier data.
Among these, the initial jobless claims report might trigger strong intraday volatility as it did in previous releases, especially with the latest NFP figure falling short of estimates.
Looking for your own spot to record your market observations & trading statistics? If so, then check out TRADEZELLA! It’s an easy-to-use
journaling tool that can lead to valuable performance & strategy insights! You can easily add your thoughts, charts & track your psychology with each and every trade. Click here to see if it’s right for you!Disclaimer: Babypips.com earns a commission from any signups through our affiliate link. When you subscribe to a service using our affiliate links, this helps us to maintain and improve our content, a lot of which is free and accessible to everyone–including the School of Pipsology! We appreciate your support and hope that you find our content and services helpful. Thank you!