


Here’s one for bitcoin bulls out there!
BTC/USD is still cruising higher inside its ascending channel and looks ready to test support again.
Check out these levels I’m watching.
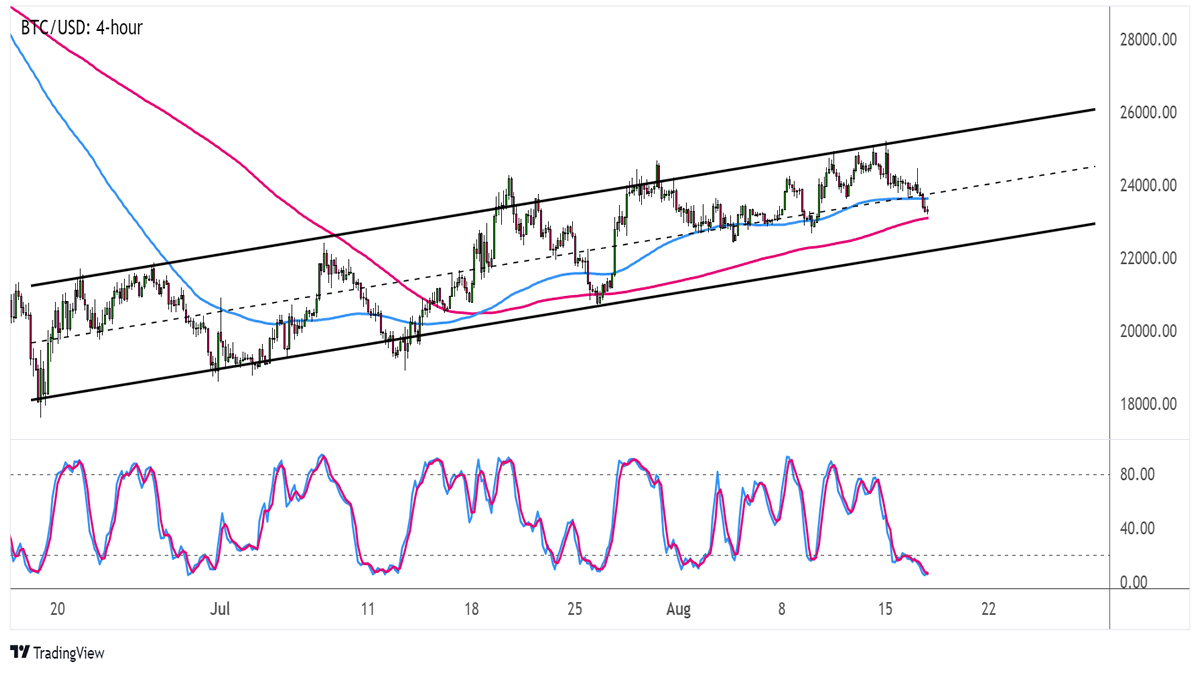
Bitcoin (BTC/USD): 4-hour
BTC/USD 4-hour Forex Chart
Bitcoin has been on a steady climb since mid-July, so this rising channel on the 4-hour time frame is lookin’ pretty solid.
Will we get another chance to buy on the dip?
BTC/USD has fallen through the mid-channel area of interest, clearing the path for a move down to the very bottom around $23,000.If support holds, price could bounce back up to the top near $26,000 or at least until the middle. A break below the floor, on the other hand, might set off a reversal from the uptrend.
Technical indicators are hinting at a likely continuation of the climb, as the 100 SMA is still above the 200 SMA while Stochastic is reflecting exhaustion among sellers.
Once the oscillator starts pulling higher, BTC/USD could follow suit as bullish pressure picks up. The 200 SMA dynamic support might even be enough to keep losses in check!
Right now, though, the crypto market seems to have taken some hits from the release of the FOMC minutes. After all, Fed policymakers reiterated the possibility of more policy tightening, giving the dollar a boost and weighing on riskier assets.
However, the minutes also noted that the central bank could slow the pace of rate hikes “at some point” depending on future data. The latest round of U.S. inflation figures pointed to weaker price pressures already, so the dollar might return these gains sooner than expected.
In any case, make sure you check the average BTC/USD volatility and practice proper risk management when trading crypto!
This content is strictly for informational purposes only and does not constitute as investment advice. Trading any financial market involves risk. Please read our Risk Disclosure to make sure you understand the risks involved.