


Are cryptocurrencies finally bottoming out?
For ether, it could all boil down to which direction this triangle breaks out!
Will market anticipation for the Ethereum Merge and Beacon Chain be enough to spur a bullish move?
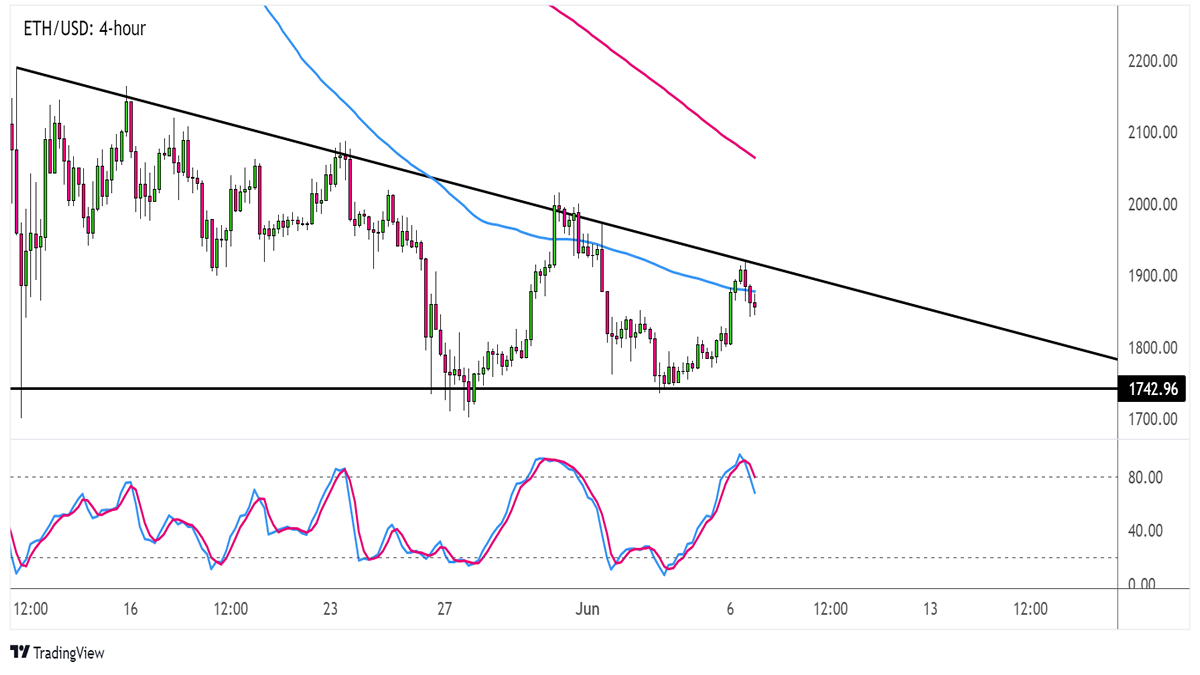
ETH/USD: 4-hour
Ethereum (ETH/USD) 4-hour Chart
ETH/USD has formed lower highs since mid-May and found support around the $1,750 level. That’s a descending triangle pattern right there!
Price is currently testing the triangle top near $1,900 and technical indicators suggest that resistance might hold again.
The 100 SMA is below the 200 SMA to signal that bearish pressure is in play. To top it off, the 100 SMA dynamic inflection point lines up with the triangle top to fortify it as a ceiling.At the same time, Stochastic is prepping to head south after reaching the overbought zone. This means that sellers are likely to take control while buyers are exhausted.
In that case, ETH/USD could slip back to the triangle support again or perhaps even attempt to break lower. If a breakdown occurs, price could tumble by the same height as the pattern, so watch out!
If you’re planning on catching a bounce off the triangle support, better wait for reversal candlesticks to form first. And don’t forget to set wide enough stop losses based on average ETH/USD volatility.
You can also check out ETH/USD pivot points.
This content is strictly for informational purposes only and does not constitute as investment advice. Trading any financial market involves risk. Please read our Risk Disclosure to make sure you understand the risks involved.