


THORChain is fast approaching its mainnet release!
So why is RUNE/USD showing wicks on the daily time frame?
Here’s a setup that I’m looking at:
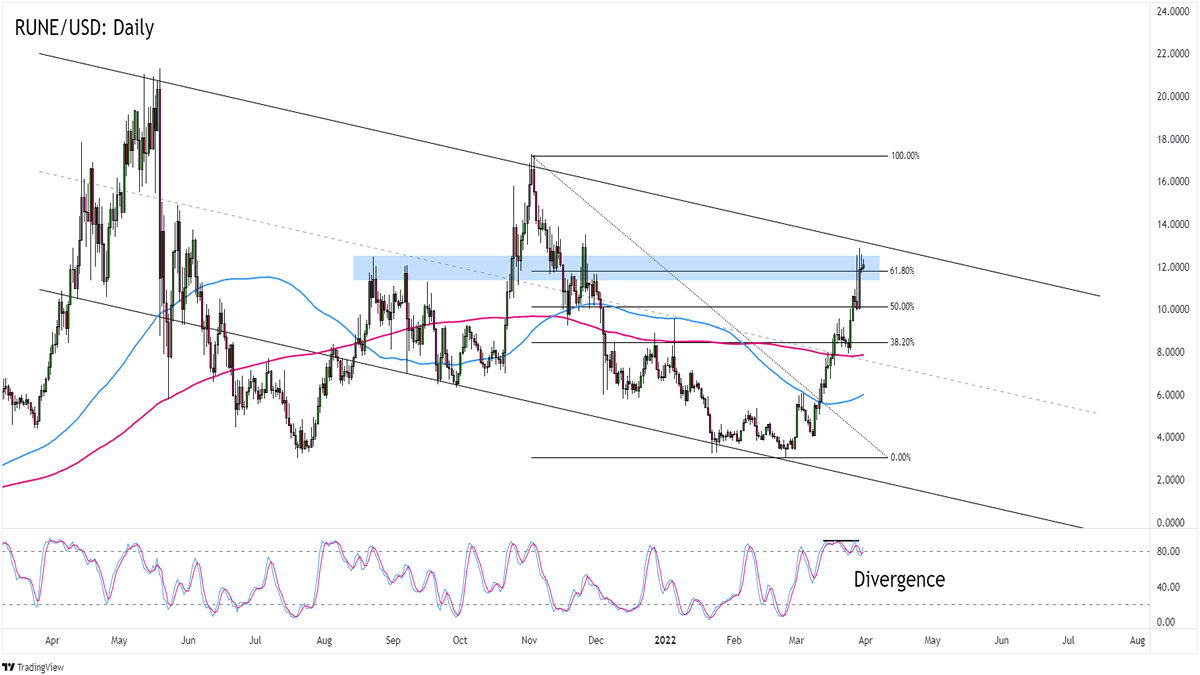
RUNE/USD: Daily
RUNE/USD: Daily Crypto Chart
A recent update from the devs of cross-chain liquidity protocol THORChain (RUNE) shared that trading volume had hit an all-time high in the last couple of weeks.
More importantly, there are only two milestones needed for a Mainnet launch.
Once these points are achieved and the network sees stable operations for 30 days, then a lot more users can have access to the protocol.The hype around the development has pushed RUNE/USD to the $12 zone. For reference, price was only at $3 earlier this month!
Unless we see more updates, though, it’s likely that we’ll see some profit-taking.
For one thing, RUNE/USD is popping up long wicks around its current levels. It doesn’t help that $12 lines up with a trend line resistance that’s been limiting RUNE’s gains since mid-2021. Last but not least is the small bearish divergence on the daily time frame.
Watch how RUNE/USD reacts to the $12 levels. If it looks like price will get rejected at the trend line resistance, then you can start pricing in a continuation of RUNE/USD’s downtrend.
But if the updates continue to roll, or if RUNE bulls manage to bust through the $12 resistance area, then RUNE/USD could revisit its previous highs near $17 or even $21.
Good luck and good trading this one!
This content is strictly for informational purposes only and does not constitute as investment advice. Trading any financial market involves risk. Please read our Risk Disclosure to make sure you understand the risks involved.