


Ether bulls, watch out!
ETH/USD is closing in on some roadblocks to its latest rally.
Will these nearby resistance levels let the selloff resume?
Ether (ETH/USD): Daily
Ether (ETH/USD) Daily Chart
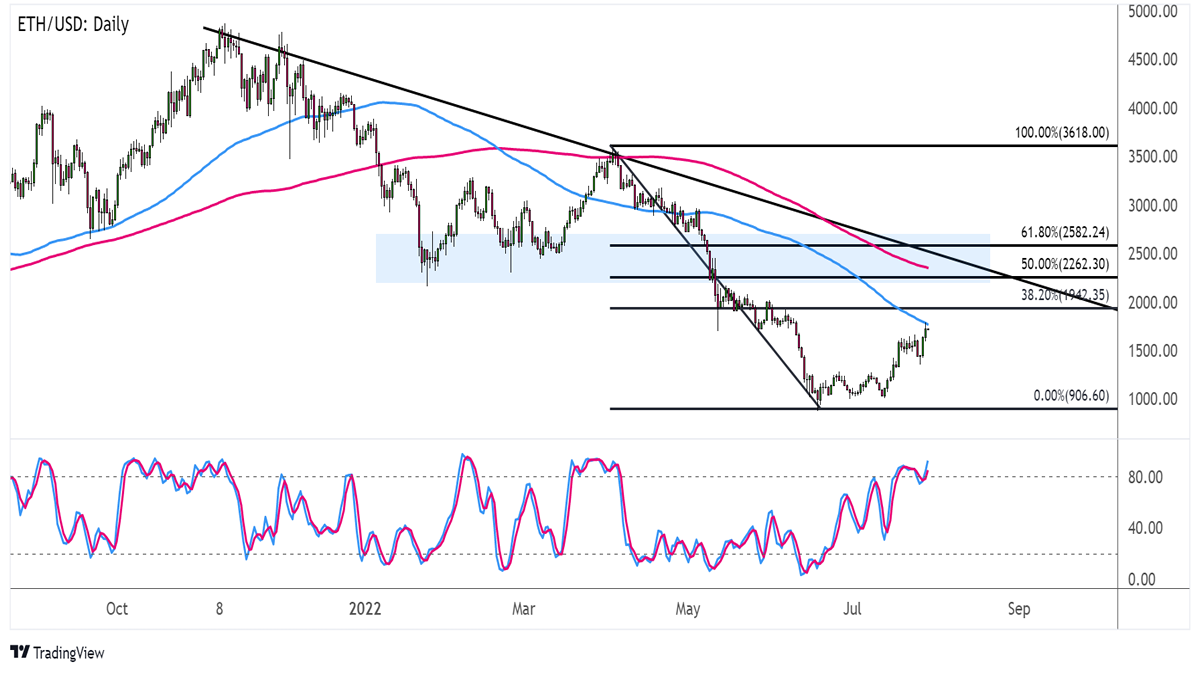
Ether has been surging for the past couple of weeks, but it’s closing in on a number of upside barriers that might cut the rally short.
You see, ETH/USD has been trending lower since October last year, with the highs connected by a descending trend line on the daily time frame.
Is this long-term downtrend likely to resume soon?
Technical indicators seem to suggest so, as the 100 SMA is below the 200 SMA and is currently holding as dynamic resistance.At the same time, Stochastic is nearing the overbought area to reflect exhaustion among buyers. Turning lower would confirm that ETH bears are back in action, so watch out!
If you’re looking to hop in a short play, stay on the lookout for reversal candlesticks right around the area of interest spanned by the Fibonacci retracement levels.
The 50% Fib lines up with a former support zone, as well as the 200 SMA dynamic inflection point. A higher pullback could take ETH/USD up to the 61.8% level closer to the long-term trend line and the key $2,500 mark.
There has been a lot of hype surrounding Ethereum‘s latest shadow fork, which is a significant milestone in its road to the ETH 2.0 network upgrade.
If the next phases go by without a glitch, the highly-anticipated merge could happen sooner rather than later, possibly allowing ETH/USD to break out of its downtrend.
This content is strictly for informational purposes only and does not constitute as investment advice. Trading any financial market involves risk. Please read our Risk Disclosure to make sure you understand the risks involved.