


With “The Merge” coming up, ETH/USD looks prime for a breakout from its long-term triangle consolidation pattern.
Which way will it go? Here are the levels I’m watching.
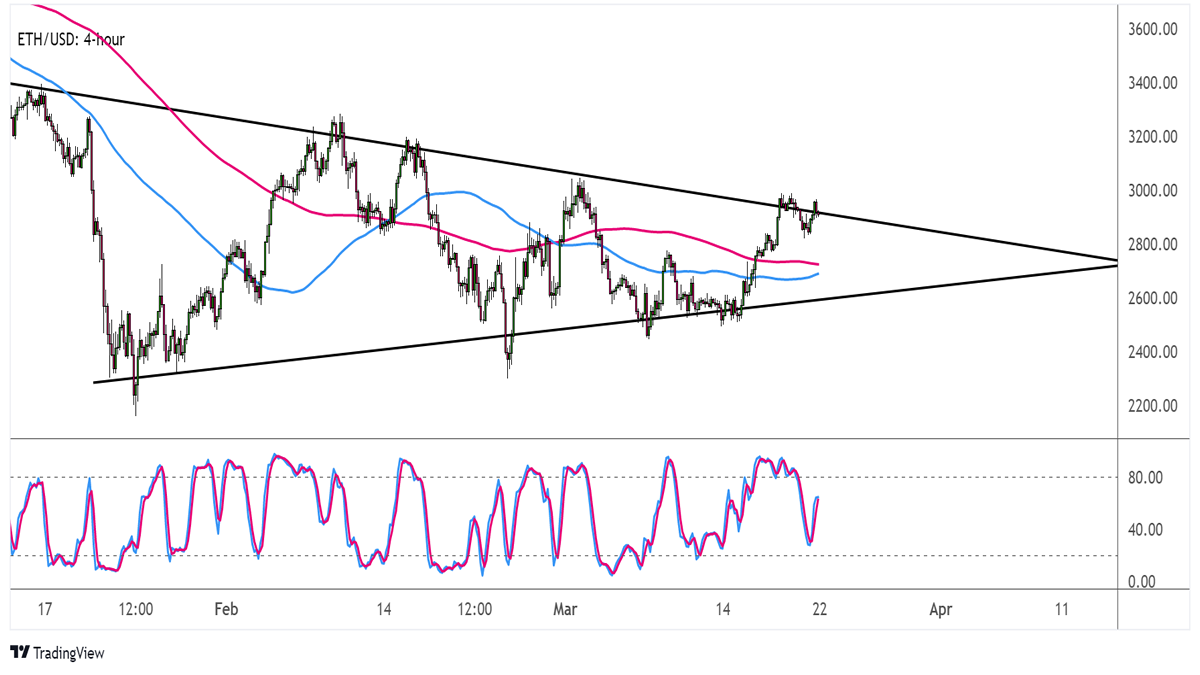
ETH/USD: 4-hour
ETH/USD 4-hour Chart
The Ethereum community has been looking forward to the merging of its mainnet with the proof-of-stake Beacon Chain for quite some time, so we might just see big moves from ETH/USD!
Price has formed lower highs and higher lows to consolidate inside a symmetrical triangle visible on its 4-hour time frame. A test of resistance is taking place, and a break higher might set off a rally that’s the same height as the chart pattern.Technical indicators are giving mixed signals, though.
The 100 SMA is below the 200 SMA to suggest that the triangle resistance around the psychological $3,000 barrier is more likely to hold than to break. On the other hand, Stochastic is pointing up to hint that ETH bulls have enough energy for a bullish move.
If the triangle top continues to hold as a ceiling, price might slump back to the bottom of the triangle around $2,600.
Word in the crypto street is that Kiln, the final public testnet, has been put to the test for developers over the past few days.
If all goes well, “The Merge” could be launched pretty soon, which would transition into officially switching Ethereum from proof-of-work to proof-of-stake protocol. Exciting stuff indeed!
This content is strictly for informational purposes only and does not constitute as investment advice. Trading any financial market involves risk. Please read our Risk Disclosure to make sure you understand the risks involved.