


Bitcoin (BTC/USD) looks ready to surpass July’s highs!
Is it time to act on FOMO and load up on BTC?
Not before BTC/USD busts through this resistance zone!
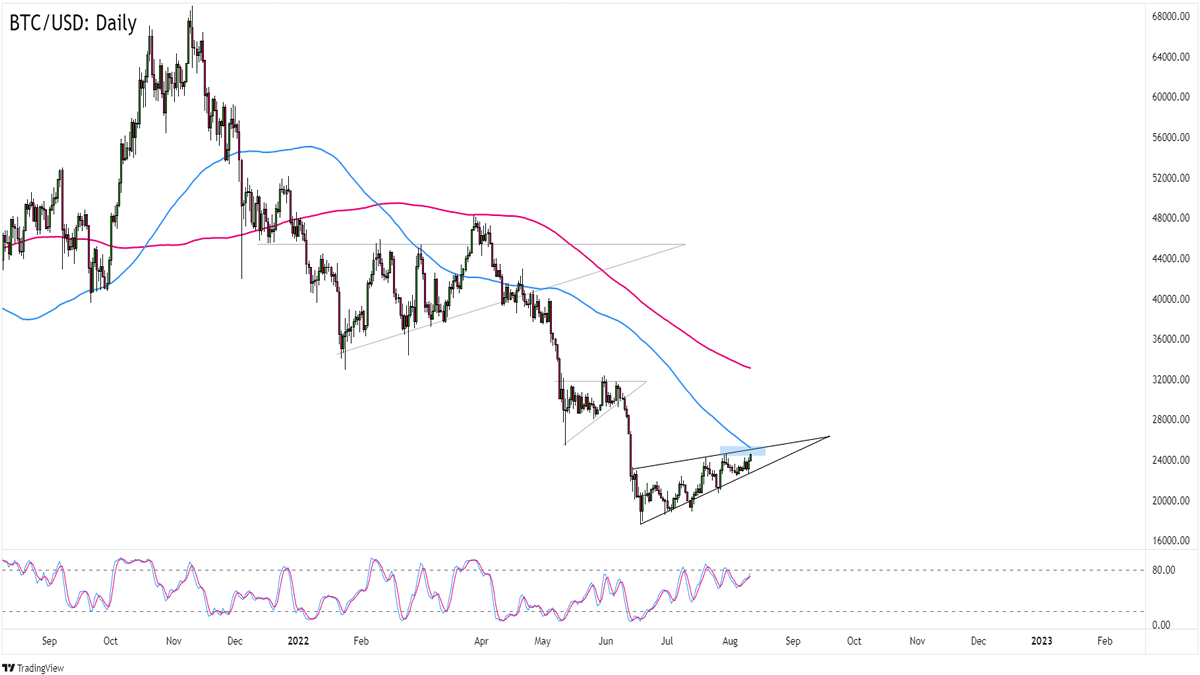
Bitcoin (BTC/USD): Daily
Bitcoin (BTC/USD) Daily Chart
If you were too busy having a Sandman marathon, you should know that Bitcoin and other “risk-friendly” assets took a bullish turn yesterday after the U.S. July CPI came in way lower than what markets had priced in.
See, decelerating inflation could convince Fed members to adopt a less hawkish tightening schedule. If the Fed slows down or “pivots” from its rate hike plans, there’s a higher chance that Uncle Sam can achieve a “soft landing” rather than a hard landing.
All the risk-taking has brought the 24K magic for BTC/USD, which has been making higher lows since late June.
Are we looking at a “bottom” for Bitcoin?Probably not. At least, not until BTC/USD busts through a key resistance zone.
BTC/USD is about to hit the daily chart’s 100 SMA that lines up with the top of a bearish wedge pattern.
Stochastic isn’t any help with its neutral signal but the 100 SMA widening its gap against the longer-term 200 SMA suggests that the downtrend still has legs.
Watch how BTC/USD reacts to the $25K zone to see if there are enough buyers to break the pair above the wedge pattern resistance.
If Bitcoin gets rejected at the 100 SMA, then we could be looking at a return to the $23,000 and $22,700 inflection points.
An upside breakout, however, just might bring more bulls to BTC’s yard and push BTC/USD to $28,500 or $31,500!
This content is strictly for informational purposes only and does not constitute as investment advice. Trading any financial market involves risk. Please read our Risk Disclosure to make sure you understand the risks involved.