


In case you were too busy with your summer plans, you should know that concerns over high interest rates and a slowdown in global growth had not escaped Bitcoin traders.
BTC/USD broke below the $28,600 support to test the $17,900 levels.
Luckily for crypto hodlers, the $17,900 – $19,000 zone is holding as support. In fact, BTC/USD is forming a Double Bottom pattern on the daily!
Is it time to start shopping for Lambos again?
BTC/USD: Daily
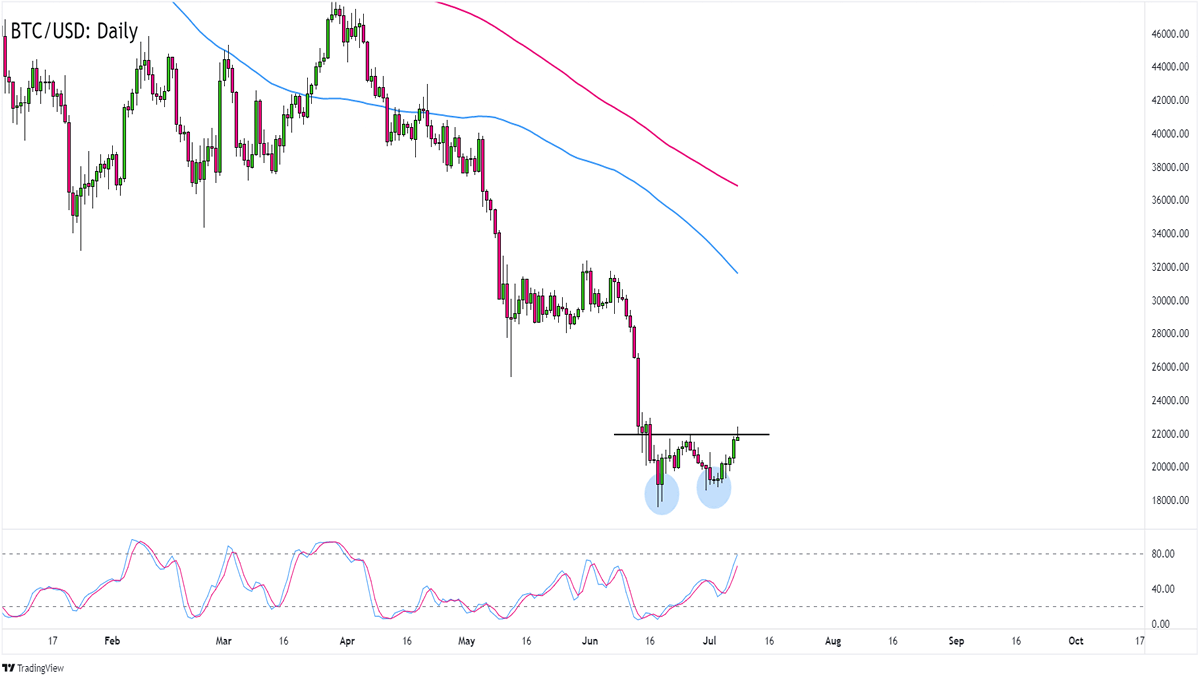
BTC/USD Daily Chart
Eh, maybe not.
Before you pepper your chat groups with 🚀🚀🚀, you should take your cues from the high inflation and high interest rate concerns, which could take center stage at the U.S. NFP report release today and the U.S. CPI release next week.
Reports that support the Fed continuing its aggressive interest rate hikes would fuel concerns that major central banks could choke economic growth and lead traders to dump “risk” assets like Bitcoin.Of course, if economic reports point to “peak” inflation or a not-so-tight labor market, then the Fed (and its peers) could start easing the pedal from the metal on their monetary tightening.
This could push risk assets like Bitcoin into more sustainable uptrends.
For now, we gotta keep our eyes on how BTC/USD reacts to the Double Bottom “neckline.”
A rejection at the $21,800 neckline would mean that there are not enough buyers to support an upside breakout.
BTC/USD could retest its June/July lows if we don’t see a change in the overall market sentiment.
If this week’s risk rally pushes BTC/USD above the neckline, though, then we can start anticipating a breakout or a break-and-retest scenario that would push Bitcoin to the $28,000 – $30,000 area of interest.
This content is strictly for informational purposes only and does not constitute as investment advice. Trading any financial market involves risk. Please read our Risk Disclosure to make sure you understand the risks involved.