


If you recall, cryptocurrencies in general paused from their 2023 uptrends on concerns about stricter regulations in the U.S. and around the globe.
But that didn’t stop BTC/USD bulls from overpowering the bears!
A bout of risk appetite helped traders shrug off Uncle Sam’s latest retail sales report that supported higher or higher-for-longer Fed interest rates.
The risk-taking spilled over to cryptocurrencies enough so that crypto data providers noted that that around $60 – $70 million worth of Bitcoin shorts were liquidated yesterday. Yipes!
BTC/USD: Daily
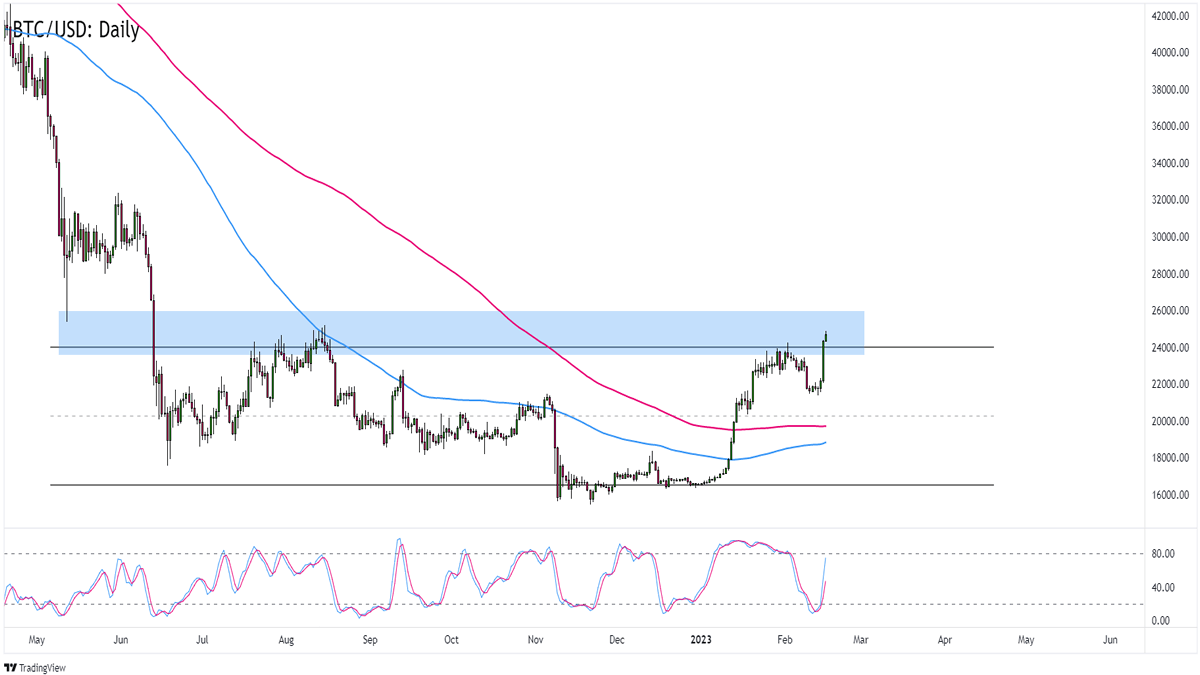
Bitcoin (BTCUSD) Daily Chart by TradingView
BTC/USD, which was chillin’ below the 22,000 mark, shot up above the 24,000 psychological handle and registered its highest levels since mid-August.
Was yesterday’s spike just a fakeout? Or are we looking at the start of a longer-term reversal?
Technical indicators are a bit mixed. Stochastic suggests that there’s still room for BTC to rise as it had just left the oversold zone.But the 100 and 200 simple moving averages are still on a flat “range” mode even as the 100 SMA tightens its gap against the longer-term 200 SMA.
The next daily candlesticks should tell us more about the sustainability of BTC/USD’s upswing.
Consistent trading above 24,000 or 25,000 opens BTC to a move back to the 29,000 – 32,000 previous area of interest.
But if this week’s U.S. PPI reports or other headlines encourage risk aversion in the markets, then BTC/USD could lose its bullish momentum from yesterday’s short squeeze and it could drop back down to the 22,000 – 23,500 previous consolidation zones.
This content is strictly for informational purposes only and does not constitute as investment advice. Trading any financial market involves risk. Please read our Risk Disclosure to make sure you understand the risks involved.