


Just when we thought that Bitcoin is headed for the moon, bears came out said “Umm, how about NO” to further gains.
What’s up with that?!
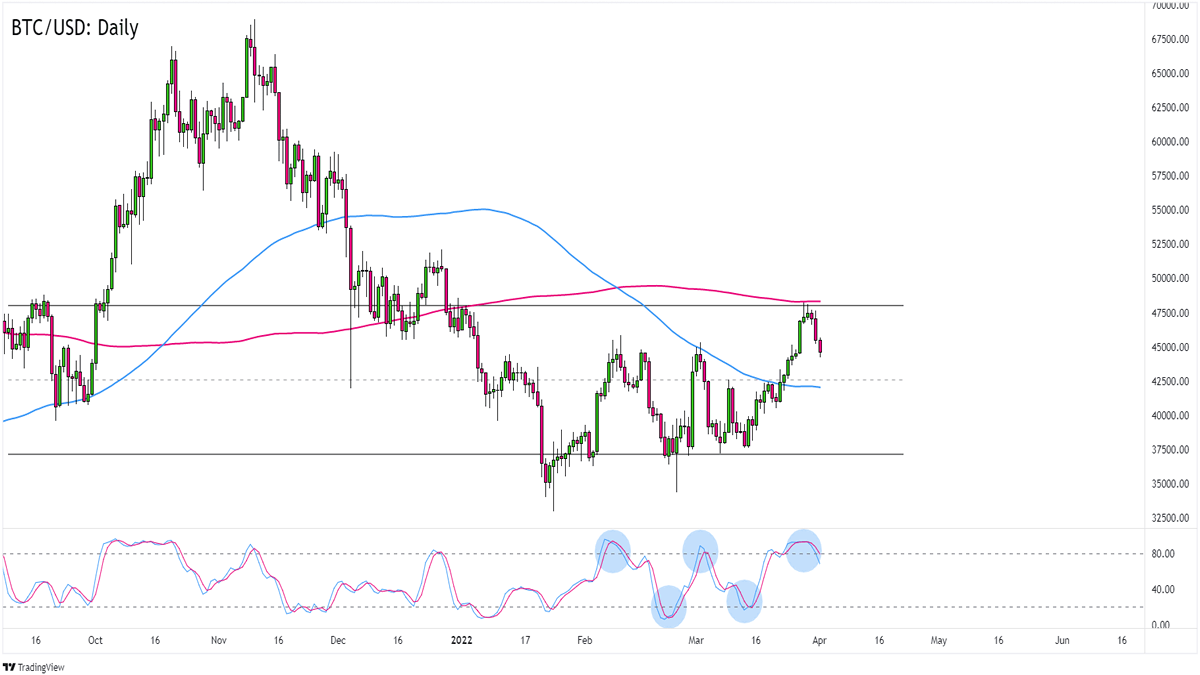
Check out BTC/USD’s daily chart:
BTC/USD: Daily
BTC/USD: Daily Crypto Chart
In case you weren’t watching cryptos in the last couple of days, Bitcoin and bajillion other altcoins had a great few weeks thanks to the risk-taking mood in the markets.
Specifically, traders were optimistic about peace talks between Russia and Ukraine (and its allies). Some also had eased their concerns about the Fed aggressively raising its interest rates.
But that was weeks ago.
Not only is Russia retaliating against EU’s sanctions with its pay-Rouble-for-gas demands, but Biden and Germany are also taking measures to reduce the impact of Russia flexing its energy muscles.
Meanwhile, China is locking down cities left and right as it battles rising COVID cases. Not good when its latest Caixin manufacturing PMI just dipped to contraction territory.The anti-risk headlines helped traders short BTC/USD at the $48,000 psychological level. It didn’t hurt that the 200 SMA on the daily time frame.
For now, Stochastic is still on the bears’ side with an overbought signal while the latest candlesticks are showing strong selling pressure.
Will the bearish momentum drag BTC to the $42,500 mid-range area?
Look out for consolidation or hesitation candlesticks near $42,500 and the 100 SMA if you’re planning on buying BTC/USD.
If you’re more of a trade-what-you-see-and-not-what-you-think type of trader, though, then you can take advantage of the current downswing and then take profits at the first signs of buying pressure.
What do you think? How low can this downswing go?
This content is strictly for informational purposes only and does not constitute as investment advice. Trading any financial market involves risk. Please read our Risk Disclosure to make sure you understand the risks involved.