


Check out that big bounce on bitcoin!
Does this mean that the fresh uptrend is about to pick up?
And just how high can BTC/USD go next? Here are the levels I’m watching.
Bitcoin (BTC/USD): 4-hour
Bitcoin (BTC/USD) 4-hour Chart
Where my bitcoin HODL-ers at?!
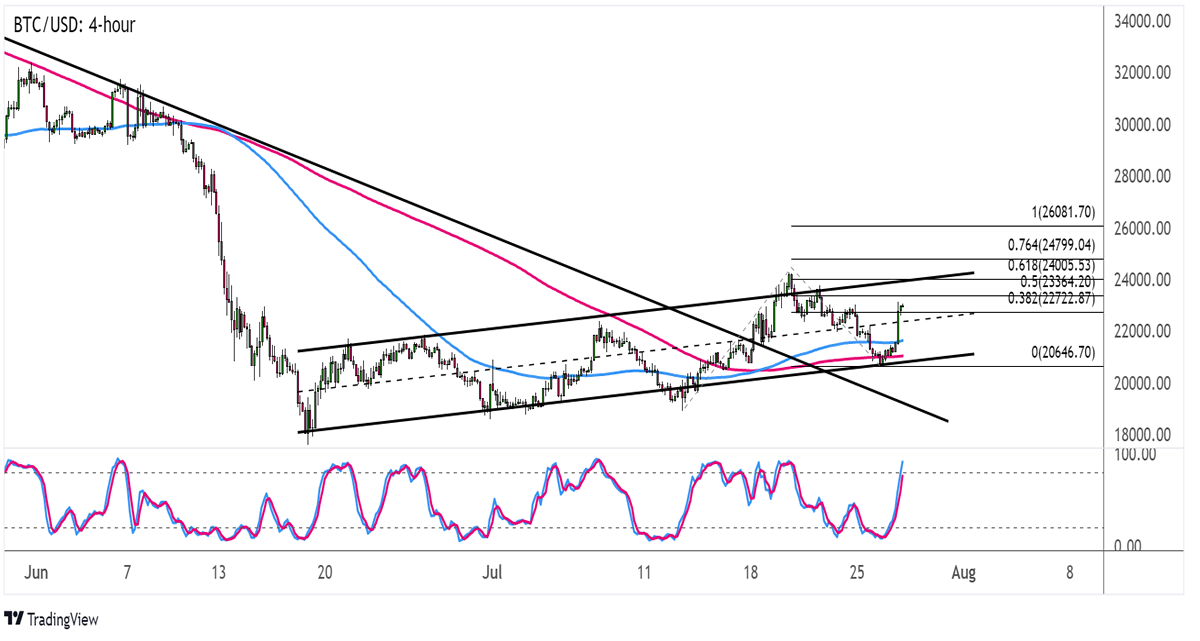
Price finally made a strong bounce off an area of interest around the rising channel support and a former longer-term descending trend line.
Are buyers setting their sights any higher from here?
The Fibonacci extension tool shows that bitcoin is already testing the 38.2% level near the mid-channel area of interest. Stronger bullish vibes could take it up to the 61.8% extension closer to the channel resistance and $24,000 mark.Sustained upside momentum might even take BTC/USD all the way up to the full extension at $26,000 so watch out!
Technical indicators are suggesting that the odds are in favor of the bulls, as the 100 SMA is above the 200 SMA while Stochastic has room to climb.
However, the oscillator is already closing in on the overbought area to reflect exhaustion among buyers soon. If sellers take over, another dip to nearby support areas could follow.
Traders seem to have revived their appetite for risk after the FOMC decision, as Fed head Powell brushed off recession jitters. Just stay on the lookout for a return in risk-off flows since these might dampen bitcoin’s gains.
This content is strictly for informational purposes only and does not constitute as investment advice. Trading any financial market involves risk. Please read our Risk Disclosure to make sure you understand the risks involved.