Gains for the euro + Losses for the yen = One happy Cyclopip!
The euro continued to power through the charts yesterday while the yen extended its slide. Fortunately for me, this was a perfect combination for my EUR/JPY long trade!
The markets went gaga for the euro after the eurozone March flash CPI showed a 2.6% rise in prices, which is even higher than the 2.4% increase that was forecasted.
This translated to additional bullishness for the euro because it means that the ECB will have even more reason to raise interest rates next week!
Also, the Irish stress test results weren’t actually that bad. Yeah, it’s true the four Irish banks that were tested are in deep doo-doo, but not as deep as everyone had feared. The tests revealed that the Irish banks had a total shortfall of 24 billion EUR, slightly lower than the 25 billion EUR-worth of losses that was widely expected.
This is actually a manageable amount because Ireland’s agreement with the EU and IMF has 35 billion EUR set aside for this… which is more than enough to cover the shortfall!
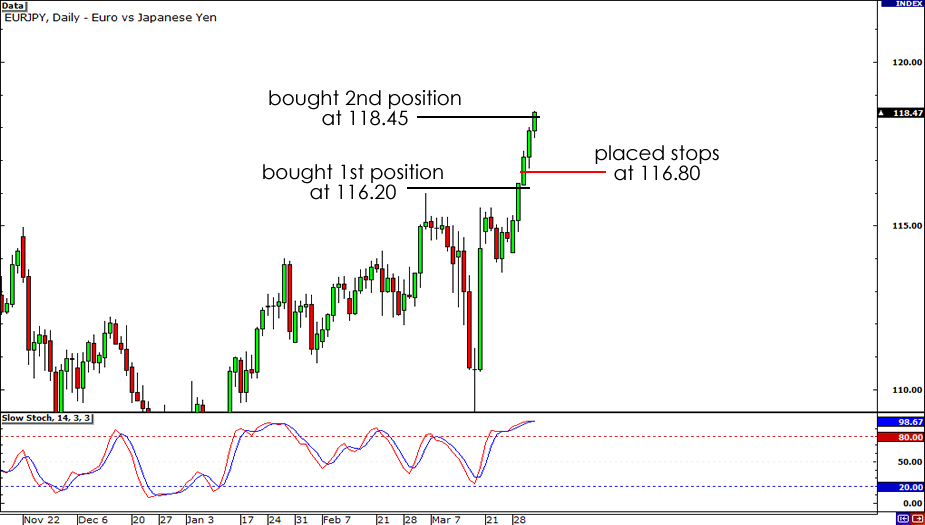
Since market conditions are becoming more favorable for my trade, I decided to press my advantage and add to my position. Here’s exactly what I did:
Bought the second position at 118.45 and placed all my stop losses at 116.80.
You’ll notice that my stop loss is about 165 pips away from the current market price. I think this is a safe distance away (it’s equal to half the pair’s WATR), even with the NFP coming out later. Unless the NFP report drops a bomb on the markets, I think EUR/JPY will hold its ground and continue to hit fresh highs.
On a side note, I’m glad to see some of you guys joined me in on this trade. Hopefully, we’ll be laughing straight to the bank when this is all over! Peace!
Trade Update
Given the current market environment, I think this setup is ripe for the picking. We all know the yen will be facing strong resistance now that the G7 has vowed to step in in case it appreciates too much. But lately, the yen’s strength actually hasn’t been much of an issue.
Just the other day, we saw broad yen weakness as USD/JPY’s strong rise spilled over to yen crosses. Rumors that the Fed may normalize monetary policy after it ends QE2 in June have been spurring risk appetite and punishing the yen.
At the same time, the focus has slowly shifted away from Portugal’s debt problems to the possibility of an ECB rate hike. With the ECB highly expected to raise rates soon, market players will probably think twice about selling the euro ahead of the ECB’s interest rate statement next Thursday… which means it’s unlikely that the euro will sell off sharply before then!
But there are still risks involved… otherwise, I would bet the farm on this trade! Ireland will be publishing its stress test results later today, and if Irish banks fail to satisfy the markets with their results, the euro may weaken.
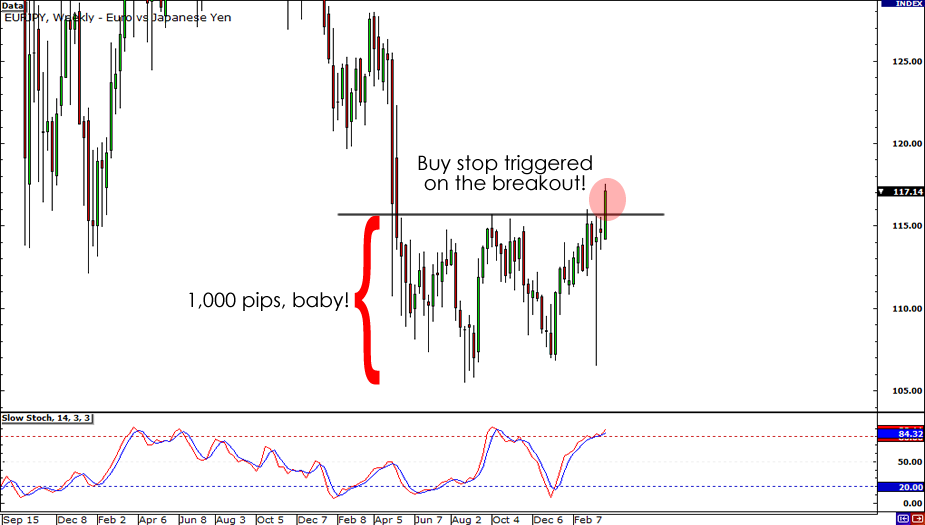
Anyway, with all the commotion in the markets, my buy order managed to get triggered. Here’s how I set up the trade:
Long EUR/JPY at 116.20, initial stop loss at 114.20, ultimate profit target at 126.20, and additional positions to be opened along the way.
I chose to use a 200-pip stop because it effectively places my stop just below the formation’s neckline, which I’m expecting to act as support in the event price pulls back. But Let’s hope it doesn’t come to that!
Taking my cue from the School of Pipsology, I’m setting my profit target about 1,000 pips away since the height of the double bottom formation is about 1,000 pips. And because the price has got quite a distance to cover before it hits my profit target, I’ll be looking to press my advantage and add to my position along the way.
So far, it’s lookin’ pretty good. We saw a strong follow-through after price broke the neckline, so I ain’t sweating yet.
Actually, I probably shouldn’t even worry so early into the trade. After all, with my stop and my profit target still hundreds of pips away, it’ll probably be days (maybe even weeks!) before things get critical.
So for now, I’mma do what I do best– sit back and relax with a bowl of bunnies… or ten!
Trade Idea
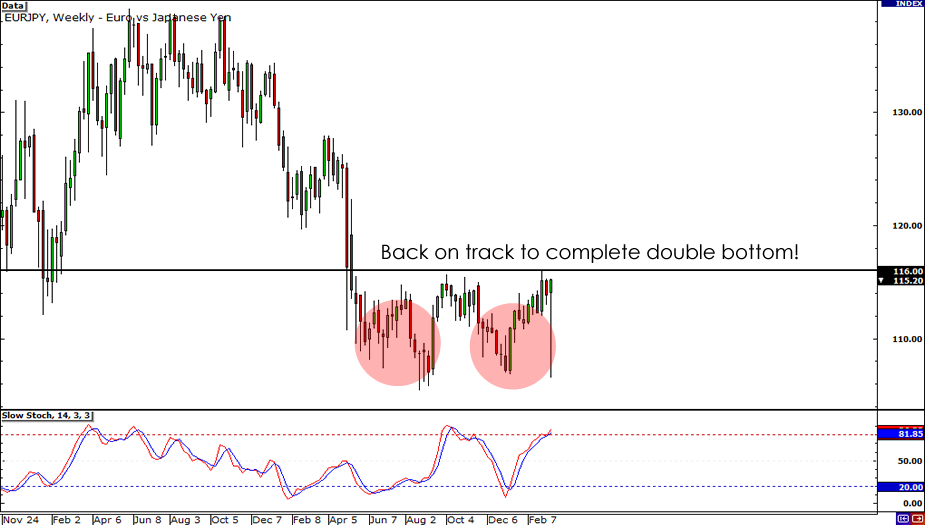
…aaaaaand we’re back to our regular programming, baby! After witnessing crazy dips and swings over the past few days, EUR/JPY finally looks like it’s back on track to complete the double bottom formation on the weekly chart.
With the price on its way to retest the neckline, it definitely seems like we may be able to capitalize on it soon! Who’s with me on this?!
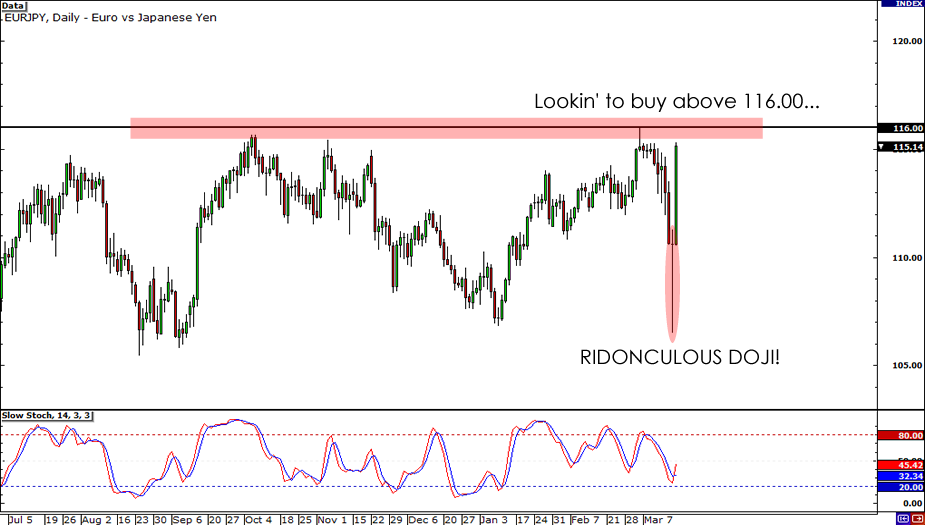
On the daily chart, things are definitely looking bullish. I mean, c’mon man, take a look at that RIDONCULOUS Doji that formed yesterday! And today’s daily candle is lookin’ as big and green as me! My only concern is that the area of 116.00 seems to be a strong resistance level. But with fundamentals on my side, I think bulls have a shot at breaking it down.
Fundies? What kinda bunnies have you been eating lately? Like Forexgump said, Interventions don’t work!
Yes, interventions historically haven’t done well… but that’s if a central bank does it alone. Today’s intervention is quite different.
In today’s G-7 meeting, G-7 leaders agreed to a “coordinated intervention”. Each of the G-7 members will be selling the yen to keep it from appreciating and to help stabilize Japan’s financial markets. This gives me a reason to believe that the markets won’t simply ignore it and send the yen soaring like we saw when the BOJ intervened back in September last year.
As for the euro, I still feel that inflation will be a major issue and give a reason for the ECB to raise rates soon. This week’s CPI report showed that inflation is still at 2.4%, still above the ECB’s target rate of 2.0%. In fact, I’ve been hearing rumors that the central bank may even raise rates as soon as their next meeting!
On the flip side, I can’t ignore the fact that sovereign debt concerns are circulating in the markets. For now, the markets haven’t reacted as strongly as they did when Greece was getting downgraded, but this is still something that worries me.
For now, I’m gonna play it safe by waiting on the other side of resistance. I’m gonna need a convincing close above 116.00 before I jump in and go long. Since I’m using a long-term time frame as my basis for this trade, I may end up holding this trade for days (possibly weeks!) if I ever do jump in. I think this has the potential to be the trade of the year!
Take note, the height of the double bottom formation is roughly 800 pips. If I take an add-as-I-go strategy, I could press my advantage and maximize my profits.
That’s all for now fellas. I’ll be sure to update you guys if I end up taking this trade. Time to get back on the couch and watch some NCAA March Madness! We’ve seen some shockers already, like Rick Pitino and Louisville getting the boot, while Kentucky survived a scare from the nerds over at Princeton!
This content is strictly for informational purposes only and does not constitute as investment advice. Trading any financial market involves risk. Please read our Risk Disclosure to make sure you understand the risks involved.


