


It looks like the sell off in crypto assets is starting to stabilize, and after a big one month drop, it makes sense to look out for solid long opportunities with good potential return-on risk.
So today, we’re taking a quick technical look at Stellar and Storj as both assets may be forming a classic bullish signal on the higher timeframe charts.
XLM/USD Daily
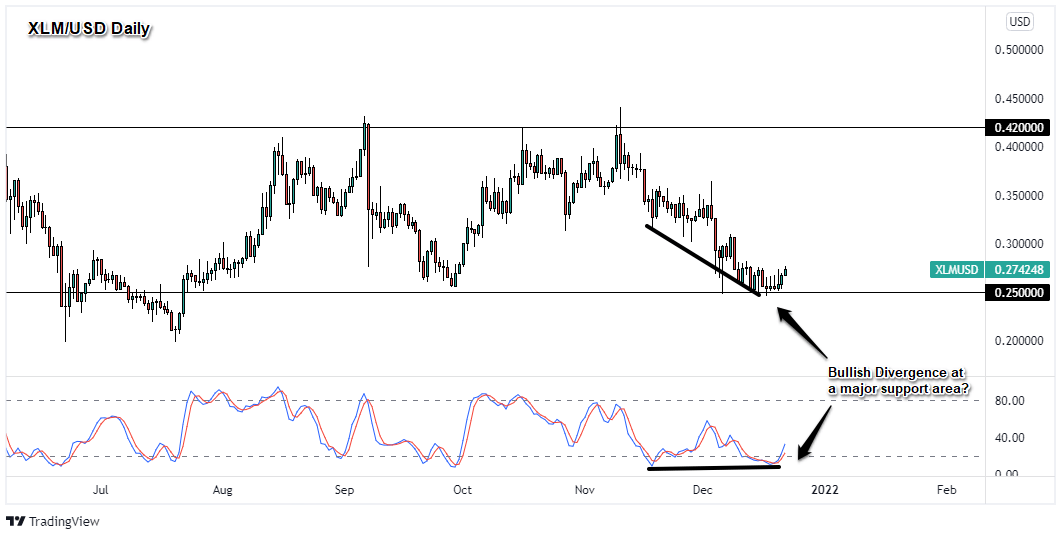
Stellar (XLM) saw a nastiy drop in November and December relative to blue chip cryptos like BTC and ETH, crashing more than -40% from the major resistance area between $0.40 – $0.44. And once again, it looks like the bulls are holding strong at the $0.25 major psychological area, which was been the jump off point for the two previous bull runs this year. Overall, it looks like a solid range pattern in the works that could be played by swing or longer-term traders.
We are seeing a bullish divergence pattern form as stochastic makes a higher ‘low’ against the lower ‘lows’ in price, a signal that may draw in technical bulls. If you’re fundamentally bullish on XLM, then this area is definitely the place to consider starting a swing long as the potential return-on-risk is very attractive with a stop somewhere just below the $0.25 major support area and target around the top of the range above.
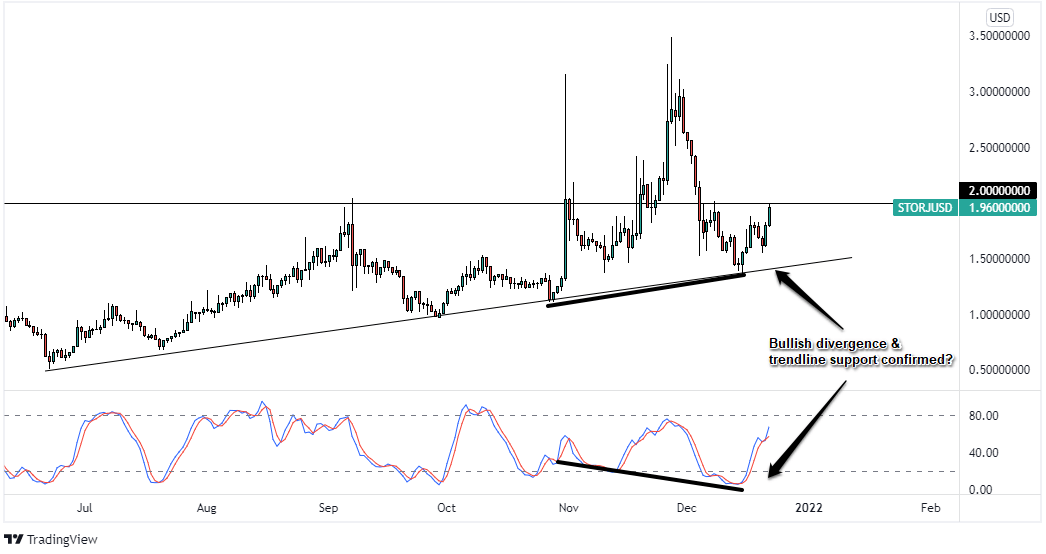
STORJ/USD Daily
Last up, but not least, we’ve got a similar divergence setup on Storj, the native token for the Storj network, a decentralized cloud storage platform. If you’re bullish on the future of a decentralized internet, then networks like Storj are ones to watch as an adoption of these services would possibly translate into more capital coming into tokens like STORJ.
And for you longer-term technical players, we’re seeing a bullish technical setup in the works after a massive -61% dip from the November highs. On the daily chart above, we can see that after falling from the $3.50 handle, the market is now retesting the rising ‘lows’ pattern marked above.
We can also see a bullish divergence between price and stochastic already formed, which is likely drawing in technical buyers and maybe even fundamental buyers at the moment.
With a bullish turn likely confirmed, there is a question of whether or not the $2.00 will act as resistance once again as it did in September and October. If the pair can break above and broad crypto sentiment continues to improve positively, then that could draw be the spark that starts the next leg up for STORJ/USD.
What do you all think? Do you think the dip in crypto prices is done? Are you checking out XLM and STORJ to play a possible reversal? Let me know in the comments section below!
This content is strictly for informational purposes only and does not constitute as investment advice. Trading any financial market involves risk. Please read our Risk Disclosure to make sure you understand the risks involved.