


Missed the neckline breakdown on crude oil?
Here are some correction levels you can keep tabs on if you’re still bearish on the commodity.
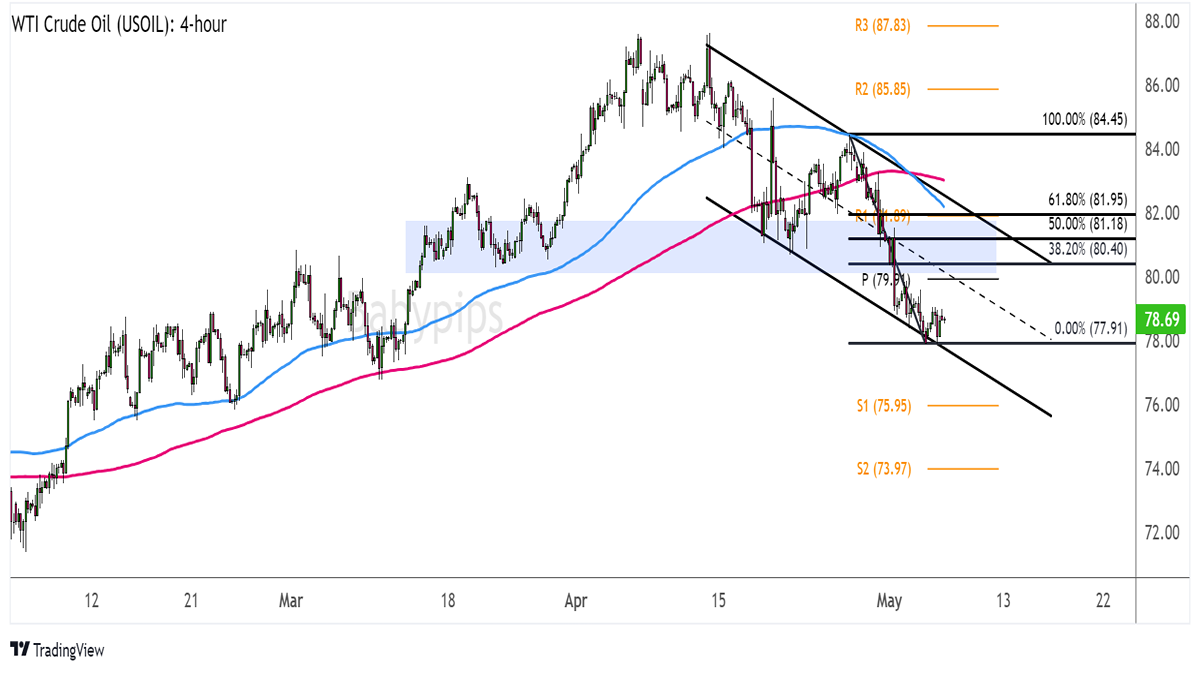
WTI Crude Oil (USOIL): 4-hour
WTI Crude Oil (USOIL) Chart by TradingView
Easing geopolitical conflict in the Middle East and a surprise build in EIA crude oil inventories dragged the energy commodity below $80 per barrel last week.
This was also enough to bring it below the neckline of the head and shoulders reversal pattern, indicating that a downtrend of the same height as the formation is in the works.
Is there still an opportunity to catch the drop at better levels?
Remember that directional biases and volatility conditions in market price are typically driven by fundamentals. If you haven’t yet done your fundie homework on crude oil, then it’s time to check out the economic calendar and stay updated on daily fundamental news!Applying the Fibonacci retracement tool on the latest slide shows that the levels span an area of interest near the broken support and a short-term channel top.
In particular, the 61.8% Fib is right around R1 ($81.89 per barrel) and channel resistance while the 38.2% level is closer to the area of interest at $80.40 per barrel.
The 100 SMA just completed a bearish crossover from the 200 SMA to confirm that the path of least resistance is to the downside or that the selloff is likely to gain traction from here.
If any of the Fibs are able to keep gains in check, crude oil traders could set their sights on the downside targets at the swing low and channel support near $78 per barrel. Sustained bearish vibes could drag it lower to S1 ($75.95 per barrel) then S2 ($73.97 per barrel), depending on how risk sentiment and geopolitical headlines turn out.
Do you think crude oil is poised for more losses from here?