


Gold just broke consolidation, but the question now is whether it’s a legit break or a fake out in the making? Where could the market move next in either case?
Take a look at these nearby inflection points.
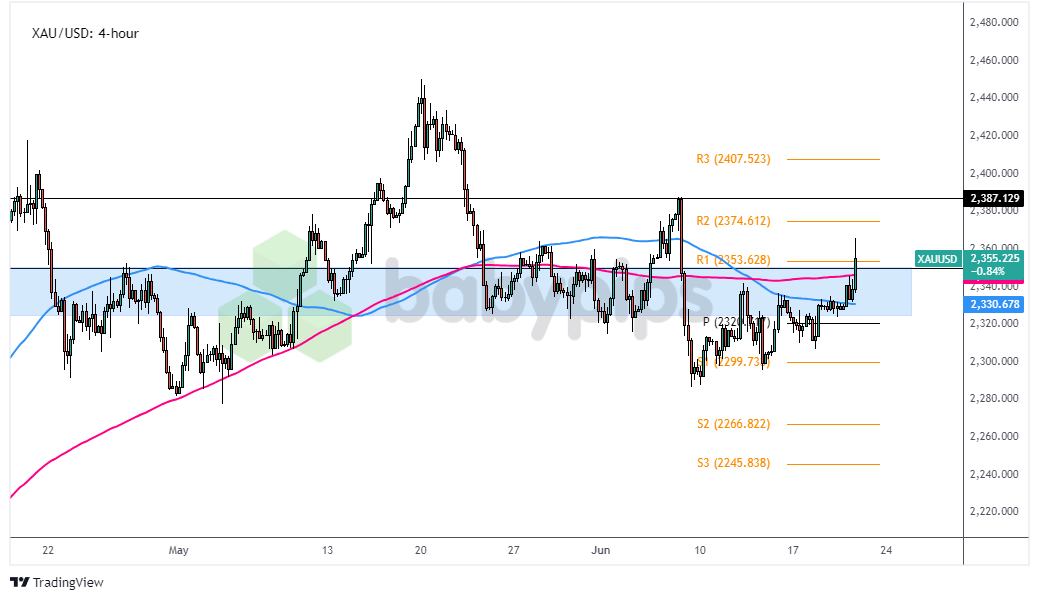
Gold (XAU/USD): 4-hour
Gold (XAU/USD) 4-hour Chart by TradingView
Heads up, gold bugs!
XAU/USD is hovering around the solid area of interest around $2,350 again, as this level has previously served as resistance then held as support before another breakdown took place.
Can it hold as a ceiling this time?
Remember that directional biases and volatility conditions in market price are typically driven by fundamentals. If you haven’t yet done your fundie homework on gold and the U.S. dollar, then it’s time to check out the economic calendar and stay updated on daily fundamental news!Flip-flopping market sentiment and Fed interest rate expectations led gold to jump back and forth this minor psychological mark, which now happens to be spanned by the 50% to 61.8% Fib levels.
To top it off, this area also coincides with a descending trend line connecting the commodity price’s highs since mid-May, as well as R1 ($2,353.63) and the 200 SMA dynamic resistance.
The 100 SMA is below the 200 SMA to suggest that resistance is more likely to hold than to break, possibly sending gold back down to the swing low at $2,285 or to the next downside targets at S1 ($2,266.82) then S2 ($2,245.84).
Do you see any market factors that could trigger dollar weakness and a gold rush soon?