


Check out these higher lows and higher highs forming on the 4-hour time frame of gold!
Will we see stronger momentum taking it to fresh highs soon?
Here are the inflection points I’m watching lately:
Gold (XAU/USD): 4-hour
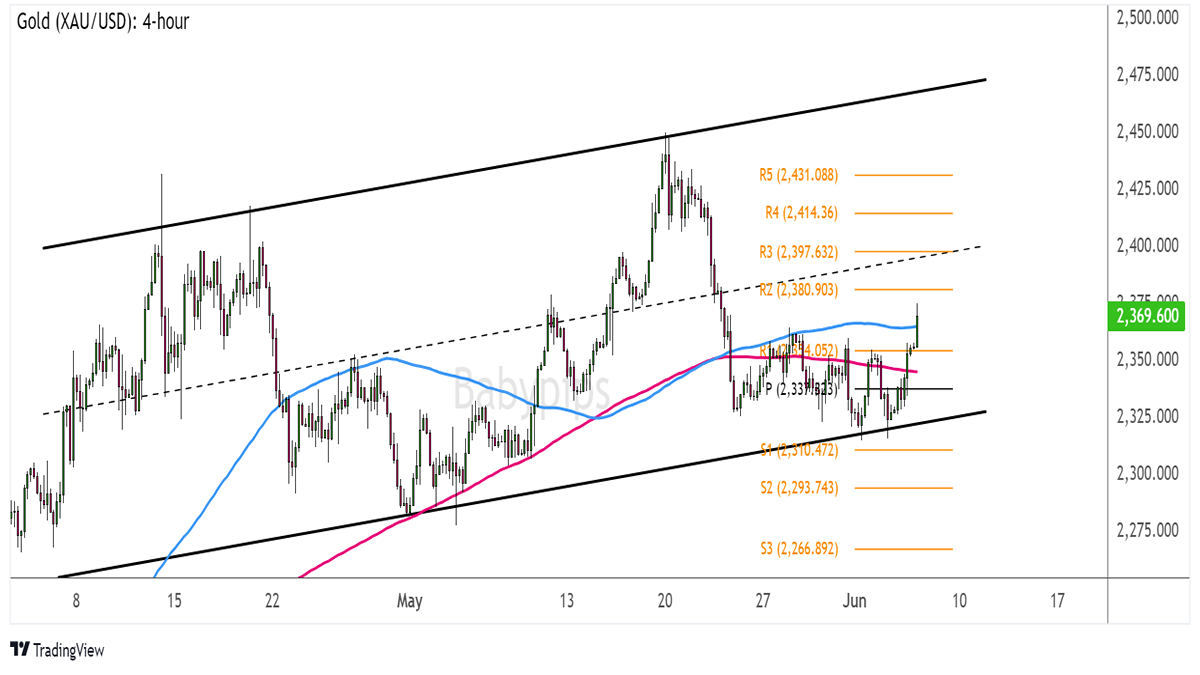
Gold (XAU/USD) 4-hour Chart by TradingView
A combo of risk-off flows and anti-USD sentiment seem to be keeping gold prices afloat these days.
After a steep drop to the $2,350 support zone and a bit of consolidation, a short-term bullish break can be seen, suggesting that there might be more upside for the precious metal.
How high can it go from here?
Doubts that the Fed can maintain its “higher for longer” outlook on borrowing costs seem to be dragging the dollar lower while global growth concerns are also encouraging investors to put money in gold instead.
Remember that directional biases and volatility conditions in market price are typically driven by fundamentals. If you haven’t yet done your fundie homework on the U.S. dollar and gold, then it’s time to check out the economic calendar and stay updated on daily fundamental news!If this kind of market dynamic keeps up, XAU/USD could stay on track towards testing the next upside targets like R3 ($2,397.63) near the $2,400 major psychological mark and the mid-channel area of interest.
Stronger bullish momentum past this point might even lift gold prices up to the latest highs at $2,450 near R5 ($2,431.09) or the channel resistance.
Another top-tier U.S. data point in the form of the non-farm payrolls report for May might still make or break dollar and gold trends, so look out for a dip back to the support area around the pivot point level and $2,350 mark if the official jobs numbers revive hawkish Fed bets.
Do you think gold can gain traction on its uptrend, though?